A Differential Expression workflow for RNA-Seq data based on the DESeq2 package from Bioconductor
Author: David Eby;Broad Institute
Contact:
gp-help@broadinstitute.org
Algorithm Version: DESeq2_1.10.1
One common task in bioinformatics is the analysis of high-throughput RNA-seq data for the purpose of finding genes which are differentially expressed across groups of samples or phenotypes. This can be accomplished by quantification and evaluation of the read count -- the number of transcripts that map to each genomic region -- which is an approximate measurement of the abundance of the target transcript [1]. Typically, read counts are mapped and attributed to genes, allowing a user to evaluate the transcription at a gene level. To determine differential expression, read counts can be compared between different classes, which are groupings of samples based on, e.g. differing phenotypes, barcodes, or transcription factor binding sites.
Although many methods exist for analyzing RNA-seq read counts, several challenges exist. Due to the nature of RNA sequencing, the resulting data can have small replicate numbers, a large dynamic range, or contain many outliers. Therefore, analysis of RNA-seq data must take these issues into account.
DESeq2 is a popular algorithm for analyzing RNA-seq data [2], which estimates the variance-mean depending in high-throughput count data, and determines differential expression based on a negative binomial distribution [3]. DESeq2 improves upon the previously published DESeq algorithm, by improving stability and interpretability of expression estimates.
The GenePattern DESeq2 module takes RNA-Seq raw count data as an input, in the GCT file format. These raw count values can be generated by HTSeq-Count [4], which determines un-normalized count values from aligned sequencing reads and a list of genomic features (e.g. genes or exons). The HTSeq-Count tool is not currently available on GenePattern. If you have data from HTSeq-counts, the GenePattern MergeHTSeqCountx module will merge multiple samples together into one GCT file, which can then be passed to DESeq2. Note that DESeq2 will not accept normalized RPKM or FPKM values, only raw count data.
In addition to the raw count data in GCT format, the DESeq2 module requires a class file in the CLS format, which categorizes samples based on, e.g. phenotype, treatment, cell type, etc. In addition, DESeq2 accepts a confounding class file, which re-categorizes samples according to a secondary class, allowing for two-factor analysis. DESeq2 completes differential expression analysis based on the provided class files. For more than two classes, the module offers the option of comparing either in a “one-versus-all” approach, or “all-pairs” approach.
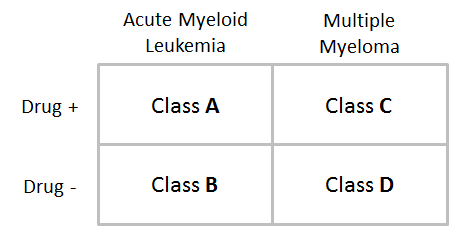
In the following example, we have a two-factor analysis grouped by two sets of classes: (1) cell type (acute myeloid leukemia vs. multiple myeloma); and (2) treatment type (drug-treated vs. untreated). Since there are two variants in each class, this gives us a total of four classes.
If we wanted to complete a single-factor analysis, e.g. just by treatment type, we would provide only one CLS file, and would not need to specify whether we want a “one-versus-all” or “all-pairs” analysis, since there are only two classes (drug-treated vs. untreated). However, since we have elected a two-factor approach, we provide a primary CLS file (cell type) and a confounding CLS file (treatment type), and must choose a type of analysis, resulting in the following comparisons:
one-versus-all: “A vs. (B and C and D)”, “B vs. (A and C and D)”, “C vs. (A and B and D)”, and “D vs. (A and B and C)”
all-pairs: “A vs. B”, “A vs. C”, “A vs. D”, “B vs. C”, “B vs. D”, “C vs. D”
| Name | Description |
|---|---|
| input file * | A GCT file containing raw RNA-Seq counts, such as is produced by MergeHTSeqCounts |
| cls file * | A categorical CLS file specifying the phenotype classes for the samples in the GCT file. This should contain exactly two classes with the control specified first. |
| confounding variable cls file | A categorical CLS file specifying an additional confounding variable, mapped to the input file samples. Use this for a two-factor comparison. |
| output file base * | The base name of the output file(s). File extensions will be added automatically. |
| qc plot format * | Choose a file format for the QC plots (or skip them completely) |
| fdr threshold * | FDR threshold to use in filtering before creating the reports of top up-regulated and down-regulated genes |
| top N count * | Max gene count to use when creating the reports of top up-regulated and down-regulated genes |
| random seed * | Seed to use for randomization |
* - required
DESeq2 will create a several output files for each comparison:
The results of the DESeq2 analysis. The results are automatically ordered by the “padj” variable, which is the Benjamini-Hochberg adjusted p-value for multiple hypothesis testing. The results columns are as follows:
Optional Output Files:
Note that, to improve performance and resource usage, the DESeq2 module pre-filters the dataset by removing any rows where the total read count is either 0 or 1; e.g. the feature has no expression value in any available class. Thus, the total rows in the results files may not match the number of rows in the input files.
Input files can be found here : https://github.com/genepattern/DESeq2/tree/develop/gpunit/Input
Example output can be found here: https://github.com/genepattern/DESeq2/tree/develop/gpunit/Output
Note that the output was created by running with the example data, and all defaults, except that the module was configured to output pdf plots.
This module requires R version 3.2.5 to be installed and for the server to be able to resolve the substitution value <R3.2_Rscript>, found on the command line.
Please see our Adminstrators guide for more information, or feel free to contact us directly.
Task Type:
Gene List Selection
CPU Type:
any
Operating System:
any
Language:
R3.2.5
| Version | Release Date | Description |
|---|---|---|
| .02 | 2016-11-03 | Initial Beta Release |