Difference between revisions of "Data formats"
| (37 intermediate revisions by 4 users not shown) | |||
| Line 1: | Line 1: | ||
| − | + | [http://www.broadinstitute.org/gsea/ GSEA Home] | | |
| − | <p>To create and edit GSEA files, use Excel or a text editor. If you are using Excel: | + | [http://www.broadinstitute.org/gsea/downloads.jsp Downloads] | |
| + | [http://www.broadinstitute.org/gsea/msigdb/ Molecular Signatures Database] | | ||
| + | [http://www.broadinstitute.org/cancer/software/gsea/wiki/index.php/Main_Page Documentation] | | ||
| + | [http://www.broadinstitute.org/gsea/contact.jsp Contact] | ||
| + | <br> | ||
| + | <br> | ||
| + | <p>Each GSEA supported file is an ASCII text file with a specific format, as described below. For sample data sets, click [http://www.broadinstitute.org/gsea/datasets.jsp here].</p> | ||
| + | <p>To create and edit GSEA files, use Excel or a text editor. If you are using Excel:</p> | ||
<ul> | <ul> | ||
| − | <li>Be aware that Excel's auto-formatting can introduce errors in gene names, as described in <span style="font-family: Arial;">[http:// | + | <li>Be aware that Excel's auto-formatting can introduce errors in gene names, as described in <span style="font-family: Arial;">[http://www.ncbi.nlm.nih.gov/pubmed/15214961 Zeeberg, et al 2004]. <br> |
| + | </span></li> | ||
</ul> | </ul> | ||
<ul> | <ul> | ||
| − | <li><span style="font-family: Arial;">To create a tab-delimited text file: select File>Save As, enter the file name in quotes to preserve the the file extension (for example, </span>"p53.gct"), and select "Text(Tab delimited)(*.txt)" as the file type. Excel displays a message warning you that your file may contain features that are not compatible with this format and asks if you want to keep the workbook in this format. Click Yes to keep this format. Your file has now been saved. Exit from Excel. When Excel asks if you want to save your changes to this file, select No (you have already saved the file). | + | <li><span style="font-family: Arial;">To create a tab-delimited text file: select File>Save As, enter the file name in quotes to preserve the the file extension (for example, </span>"p53.gct"), and select "Text(Tab delimited)(*.txt)" as the file type. Excel displays a message warning you that your file may contain features that are not compatible with this format and asks if you want to keep the workbook in this format. Click Yes to keep this format. Your file has now been saved. Exit from Excel. When Excel asks if you want to save your changes to this file, select No (you have already saved the file). |
| + | </li> | ||
</ul> | </ul> | ||
<p><span style="font-family: Arial;">When creating files for GSEA, do not use hypens (-) in the file names. Due to restrictions imposed by certain Java libraries used by GSEA, the GSEA command line cannot accept file names that contain hypens.</span></p> | <p><span style="font-family: Arial;">When creating files for GSEA, do not use hypens (-) in the file names. Due to restrictions imposed by certain Java libraries used by GSEA, the GSEA command line cannot accept file names that contain hypens.</span></p> | ||
| Line 13: | Line 22: | ||
<p class="MsoNormal">The GCT format is a tab delimited file format that describes an expression dataset. It is organized as follows: </p> | <p class="MsoNormal">The GCT format is a tab delimited file format that describes an expression dataset. It is organized as follows: </p> | ||
<p class="MsoNormal">[[image:gct_format_snapshot.gif]]</p> | <p class="MsoNormal">[[image:gct_format_snapshot.gif]]</p> | ||
| − | <p class="MsoNormal">The <strong style="">first line</strong> contains the version string and is always the same for this file format. Therefore, the first line must be as follows:<code><span style="font-size: 10pt;"><br /></span></code></p> | + | <p class="MsoNormal">The <strong style="">first line</strong> contains the version string and is always the same for this file format. Therefore, the first line must be as follows:<code><span style="font-size: 10pt;"><br /> |
| − | <div style="margin-left: 40px;"><code><span style="font-size: 10pt;">#1.2</span></code><br /><code | + | </span></code></p> |
| + | <div style="margin-left: 40px;"><code><span style="font-size: 10pt;">#1.2</span></code><br /> | ||
| + | <code></code></div> | ||
<p class="MsoNormal">The <strong style="">second line</strong> contains numbers indicating the size of the data table that is contained in the remainder of the file. Note that the name and description columns are not included in the number of data columns. </p> | <p class="MsoNormal">The <strong style="">second line</strong> contains numbers indicating the size of the data table that is contained in the remainder of the file. Note that the name and description columns are not included in the number of data columns. </p> | ||
| − | Line format:<span style=""> </span>(<code><span style="font-size: 10pt;"># of data rows) (tab) (# of data columns)</span></code><br />< | + | Line format:<span style=""> </span>(<code><span style="font-size: 10pt;"># of data rows) (tab) (# of data columns)</span></code><br /> |
| − | <p class="MsoNormal">< | + | <code>Example:<span style=""> </span><code><span style="font-size: 10pt;">7129 58</span></code><br /> |
| − | Line format:<span style=""> </span><code><span style="font-size: 10pt;">Name(tab)Description(tab)(sample 1 name)(tab)(sample 2 name) (tab) ... (sample N name)</span></code><br />< | + | </code> |
| − | <p class="MsoNormal"> The <strong style="">remainder</strong> of the data file contains data for each of the genes. There is one | + | <p class="MsoNormal"><code>The <strong style="">third line</strong> contains a list of identifiers for the samples associated with each of the columns in the remainder of the file. </code></p> |
| − | <p style="" class="MsoNormal">Line format:<span style=""> </span><code><span style="font-size: 10pt;">(gene name) (tab) (gene description) (tab) (col 1 data) (tab) (col 2 data) (tab) ... (col N data)<br /></span></code>Example:<span style=""> </span> <code><span style="font-size: 10pt;">AFFX-BioB-5_at AFFX-BioB-5_at (endogenous control) -104 -152 -158 ... -44</span></code>< | + | Line format:<span style=""> </span><code><span style="font-size: 10pt;">Name(tab)Description(tab)(sample 1 name)(tab)(sample 2 name) (tab) ... (sample N name)</span></code><br /> |
| + | <code>Example:<span style=""> </span><code><span style="font-size: 10pt;">Name Description DLBC1_1 DLBC2_1 ... DLBC58_0</span></code><br /> | ||
| + | </code> | ||
| + | <p class="MsoNormal"> The <strong style="">remainder</strong> of the data file contains data for each of the genes. There is one row for each gene and one column for each of the samples. The number of rows and columns should agree with the number of rows and columns specified on line 2. Each row contains a name, a description, and an intensity value for each sample. Names and descriptions can contain spaces, but may not be empty. If no description is available, enter a text string such as NA or NULL. Intensity values may be missing. To specify a missing intensity value, leave the field empty: ...(tab)(tab).... <br /> | ||
| + | </p> | ||
| + | <p style="" class="MsoNormal">Line format:<span style=""> </span><code><span style="font-size: 10pt;">(gene name) (tab) (gene description) (tab) (col 1 data) (tab) (col 2 data) (tab) ... (col N data)<br /> | ||
| + | </span></code>Example:<span style=""> </span> <code><span style="font-size: 10pt;">AFFX-BioB-5_at AFFX-BioB-5_at (endogenous control) -104 -152 -158 ... -44</span></code></p> | ||
| + | <p style="" class="MsoNormal"><strong>Example file</strong>: [http://www.broadinstitute.org/gsea/msigdb/download_file.jsp?filePath=/resources/dataset_files/P53_hgu95av2.gct P53_hgu95av2.gct]</p> | ||
<h2>RES: ExpRESsion (with P and A calls) file format (*.res) </h2> | <h2>RES: ExpRESsion (with P and A calls) file format (*.res) </h2> | ||
<p class="MsoNormal">The RES file format is a tab delimited file format that describes an expression dataset. It is organized as follows. The main difference between RES and GCT file formats is the RES file format contains labels for each gene's absent (A) versus present (P) calls as generated by Affymetrix's GeneChip software.</p> | <p class="MsoNormal">The RES file format is a tab delimited file format that describes an expression dataset. It is organized as follows. The main difference between RES and GCT file formats is the RES file format contains labels for each gene's absent (A) versus present (P) calls as generated by Affymetrix's GeneChip software.</p> | ||
| Line 37: | Line 55: | ||
<p class="MsoNormal">For example:<span style=""> </span><code><span style="font-size: 10pt;">AFFX-BioB-5_at (endogenous control) AFFX-BioB-5_at -104 A -152 A ... -44 A</span></code> </p> | <p class="MsoNormal">For example:<span style=""> </span><code><span style="font-size: 10pt;">AFFX-BioB-5_at (endogenous control) AFFX-BioB-5_at -104 A -152 A ... -44 A</span></code> </p> | ||
<h2>PCL: Stanford cDNA file format (*.pcl) </h2> | <h2>PCL: Stanford cDNA file format (*.pcl) </h2> | ||
| − | <p class="MsoNormal">The PCL file format is a tab delimited file format that describes an expression dataset. It is organized as follows. Support for this format is provided because several Stanford cDNA datasets are available in the PCL format. For more information, see [http://genome-www5.stanford.edu/help/formats.shtml#pcl Stanford pcl file format].<br /> </p> | + | <p class="MsoNormal">The PCL file format is a tab delimited file format that describes an expression dataset. It is organized as follows. Support for this format is provided because several Stanford cDNA datasets are available in the PCL format. For more information, see [http://genome-www5.stanford.edu/help/formats.shtml#pcl Stanford pcl file format].<br /> |
| − | <p class="MsoNormal" style="">[[image:pcl_format_snapshot.gif]]</p> | + | </p> |
| + | <p class="MsoNormal" style="">[[image:pcl_format_snapshot.gif]]<br /> | ||
| + | </p> | ||
| + | <h2>TXT: Text file format for expression dataset (*.txt)</h2> | ||
| + | <p class="MsoNormal">The TXT format is a tab delimited file format that describes an expression dataset. It is organized as follows:</p> | ||
| + | <p class="MsoNormal">[[image:Txt_format_snapshot.gif]]</p> | ||
| + | <p class="MsoNormal">The <strong style="">first line</strong> contains the labels Name and Description followed by the identifiers for each sample in the dataset. '''NOTE:''' The Description column is intended to be optional, but there is currently a bug such that it is treated as required. We hope to fix this in a future release. If you have no descriptions available, a value of NA will suffice.<br /> | ||
| + | </p> | ||
| + | Line format:<span style=""> </span><code><span style="font-size: 10pt;">Name(tab)Description(tab)(sample 1 name)(tab)(sample 2 name) (tab) ... (sample N name)</span></code><br /> | ||
| + | <code>Example:<span style=""> </span><code><span style="font-size: 10pt;">Name Description DLBC1_1 DLBC2_1 ... DLBC58_0</span></code><br /> | ||
| + | </code> | ||
| + | <p class="MsoNormal"> The <strong style="">remainder</strong> of the file contains data for each of the genes. There is one line for each gene. Each line contains the gene name, gene description, and a value for each sample in the dataset. <!-- If the first line contains the Description label, include a description for each gene. If the first line does not contain the Description label, do not include descriptions for any gene.--> <br /><br /> | ||
| + | Gene names and descriptions can contain spaces since fields are separated by tabs. <br /> | ||
| + | </p> | ||
| + | <!-- | ||
| + | Line format:<span style=""> </span><code><span style="font-size: 10pt;">(gene name) (tab) (gene description) (tab) (col 1 data) (tab) (col 2 data) (tab) ... (col N data)<br /> | ||
| + | </span></code>Example:<span style=""> </span> <code><span style="font-size: 10pt;">AFFX-BioB-5_at AFFX-BioB-5_at (endogenous control) -104 -152 -158 ... -44</span></code> | ||
| + | --> | ||
<h1>Phenotype Data Formats</h1> | <h1>Phenotype Data Formats</h1> | ||
<h2>CLS: Categorical (e.g tumor vs normal) class file format (*.cls) </h2> | <h2>CLS: Categorical (e.g tumor vs normal) class file format (*.cls) </h2> | ||
<p class="MsoNormal">The CLS file format defines phenotype (class or template) labels and associates each sample in the expression data with a label. The CLS file format uses spaces or tabs to separate the fields.</p> | <p class="MsoNormal">The CLS file format defines phenotype (class or template) labels and associates each sample in the expression data with a label. The CLS file format uses spaces or tabs to separate the fields.</p> | ||
| − | <p class="MsoNormal">The CLS file format differs somewhat depending on whether you are defining categorical or continuous phenotypes. Categorical labels define discrete phenotypes; for example, normal vs tumor | + | <p class="MsoNormal">The CLS file format differs somewhat depending on whether you are defining categorical or continuous phenotypes. Categorical labels define discrete phenotypes; for example, normal vs tumor. For categorical labels, the CLS file format is organized as follows:</p> |
<p class="MsoNormal">[[image:cls_format_snapshot.png]]</p> | <p class="MsoNormal">[[image:cls_format_snapshot.png]]</p> | ||
<p class="MsoNormal">The <strong style="">first line</strong> of a CLS file contains numbers indicating the number of samples and number of classes. The number of samples should correspond to the number of samples in the associated RES or GCT data file. </p> | <p class="MsoNormal">The <strong style="">first line</strong> of a CLS file contains numbers indicating the number of samples and number of classes. The number of samples should correspond to the number of samples in the associated RES or GCT data file. </p> | ||
<p class="MsoNormal">Line format:<span style=""> </span><code><span style="font-size: 10pt;">(number of samples) (space) (number of classes) (space) 1 </span></code></p> | <p class="MsoNormal">Line format:<span style=""> </span><code><span style="font-size: 10pt;">(number of samples) (space) (number of classes) (space) 1 </span></code></p> | ||
<p class="MsoNormal">Example:<span style=""> </span><code><span style="font-size: 10pt;">58 2 1 </span></code></p> | <p class="MsoNormal">Example:<span style=""> </span><code><span style="font-size: 10pt;">58 2 1 </span></code></p> | ||
| − | <p class="MsoNormal">The <strong style="">second line</strong> in a CLS file contains a name for each class. These are the class names that appear in analysis reports. The line should begin with a pound sign (#) followed by a space. </p> | + | <p class="MsoNormal">The <strong style="">second line</strong> in a CLS file contains a user-visible name for each class. These are the class names that appear in analysis reports. The line should begin with a pound sign (#) followed by a space. </p> |
<p class="MsoNormal">Line format:<span style=""> </span><code><span style="font-size: 10pt;"># (space) (class 0 name) (space) (class 1 name)</span></code> </p> | <p class="MsoNormal">Line format:<span style=""> </span><code><span style="font-size: 10pt;"># (space) (class 0 name) (space) (class 1 name)</span></code> </p> | ||
<p class="MsoNormal">Example:<span style=""> </span><code><span style="font-size: 10pt;"># cured fatal/ref</span></code> </p> | <p class="MsoNormal">Example:<span style=""> </span><code><span style="font-size: 10pt;"># cured fatal/ref</span></code> </p> | ||
| − | <p class="MsoNormal">The <strong style="">third line</strong> contains a class label for each sample. The label | + | <p class="MsoNormal">The <strong style="">third line</strong> contains a class label for each sample. The class label can be the class name, a number, or a text string. The first label used is assigned to the first class named on the second line; the second unique label is assigned to the second class named; and so on. The number of class labels specified on this line should be the same as the number of samples specified in the first line. The number of unique class labels specified on this line should be the same as the number of classes specified in the first line.<br /> |
| + | </p> | ||
| + | <p class="MsoNormal"><span style="font-weight: bold;">Note: </span>The order of the labels on the third line determines the association of class names and class labels, even if the class labels are the same as the class names and even if the labels are numbers. The key point is that as the third line is processed left-to-right, it will take the first label it finds <span style="font-weight: bold;">no matter what it is</span> and map it to the first class name from the second line (also left-to-right). Any other instances of that label then map to that same name. | ||
| + | |||
| + | After that, the second label found (on the third line) <span style="font-weight: bold;">different from the first</span> is mapped to the second name (on the second line), and likewise for any other instances. If there are more unique labels than there are names then you'll get an error. | ||
| + | |||
| + | Since the third line represents your samples column-wise as they appear in the expression dataset, you need to arrange the class names on the second line in the order in which they're first encountered among your samples. If you're also using numbers for labels, then you should encounter [0, 1, 2, ...] in order on the third line when reading left-to-right. | ||
| + | <br /> | ||
| + | </p> | ||
<p class="MsoNormal">Line format:<span style=""> </span><code><span style="font-size: 10pt;">(sample 1 class) (space) (sample 2 class) (space) ... (sample N class)</span></code></p> | <p class="MsoNormal">Line format:<span style=""> </span><code><span style="font-size: 10pt;">(sample 1 class) (space) (sample 2 class) (space) ... (sample N class)</span></code></p> | ||
<p class="MsoNormal">Example:<span style=""> </span><code><span style="font-size: 10pt;">0 0 0 ... 1 1</span></code></p> | <p class="MsoNormal">Example:<span style=""> </span><code><span style="font-size: 10pt;">0 0 0 ... 1 1</span></code></p> | ||
| + | <p class="MsoNormal"><strong>Example file</strong>: [http://www.broadinstitute.org/gsea/msigdb/download_file.jsp?filePath=/resources/dataset_files/P53.cls P53.cls]</p> | ||
<h2>CLS: Continuous (e.g time-series or gene profile) file format (*.cls) </h2> | <h2>CLS: Continuous (e.g time-series or gene profile) file format (*.cls) </h2> | ||
<p class="MsoNormal">The CLS file format defines phenotype (class or template) labels and associates each sample in the expression data with a label. The CLS file format uses spaces or tabs to separate the fields.</p> | <p class="MsoNormal">The CLS file format defines phenotype (class or template) labels and associates each sample in the expression data with a label. The CLS file format uses spaces or tabs to separate the fields.</p> | ||
| − | <p class="MsoNormal">The CLS file format differs somewhat depending on whether you are defining categorical or continuous phenotypes. Continuous phenotypes are used for time series experiments or to find gene sets | + | <p class="MsoNormal">The CLS file format differs somewhat depending on whether you are defining categorical or continuous phenotypes. Continuous phenotypes are used for time series experiments or to find gene sets correlated with a gene of interest (gene neighbors). A CLS file for continuous labels can contain one or more labels. The following example shows a CLS file that defines two continuous labels:<br /> |
| − | <p class="MsoNormal">#numeric<br />#AFFX-BioB-5_st<br />206.0 31.0 252.0 -20.0 -169.0 -66.0 230.0 -23.0 67.0 173.0 -55.0 -20.0 469.0 -201.0 -117.0 -162.0 -5.0 -86.0 350.0 74.0 -215.0 193.0 506.0 183.0 350.0 113.0 -17.0 29.0 247.0 -131.0 358.0 561.0 24.0 524.0 167.0 -56.0 176.0 320.0<br />#AFFX-BioDn-5<br />75.0 142.0 32.0 109.0 -38.0 -80.0 62.0 39.0 196.0 -42.0 199.0 49.0 171.0 327.0 115.0 -71.0 85.0 80.0 270.0 182.0 208.0 -94.0 292.0 233.0 34.0 0.0 59.0 233.0 48.0 466.0 -7.0 -96.0 297.0 38.0 208.0 -15.0 30.0 357.0<br /></p> | + | <br /> |
| − | <br />The <span style="font-weight: bold;">first </span>line contains the text "#numeric" which indicates that the file defines continuous labels.<br />The <span style="font-weight: bold;">remainder </span>of the file defines the continuous phenotypes. For each phenotype: | + | </p> |
| + | <p class="MsoNormal"><span style="font-family: courier new;">#numeric</span><br style="font-family: courier new;" /> | ||
| + | <span style="font-family: courier new;">#AFFX-BioB-5_st</span><br style="font-family: courier new;" /> | ||
| + | <span style="font-family: courier new;">206.0 31.0 252.0 -20.0 -169.0 -66.0 230.0 -23.0 67.0 173.0 -55.0 -20.0 469.0 -201.0 -117.0 -162.0 -5.0 -86.0 350.0 74.0 -215.0 193.0 506.0 183.0 350.0 113.0 -17.0 29.0 247.0 -131.0 358.0 561.0 24.0 524.0 167.0 -56.0 176.0 320.0</span><br style="font-family: courier new;" /> | ||
| + | <span style="font-family: courier new;">#AFFX-BioDn-5</span><br style="font-family: courier new;" /> | ||
| + | <span style="font-family: courier new;">75.0 142.0 32.0 109.0 -38.0 -80.0 62.0 39.0 196.0 -42.0 199.0 49.0 171.0 327.0 115.0 -71.0 85.0 80.0 270.0 182.0 208.0 -94.0 292.0 233.0 34.0 0.0 59.0 233.0 48.0 466.0 -7.0 -96.0 297.0 38.0 208.0 -15.0 30.0 357.0</span><br /> | ||
| + | </p> | ||
| + | <br /> | ||
| + | The <span style="font-weight: bold;">first </span>line contains the text "#numeric" which indicates that the file defines continuous labels.<br /> | ||
| + | The <span style="font-weight: bold;">remainder </span>of the file defines the continuous phenotypes. For each phenotype: | ||
<ul> | <ul> | ||
| − | <li>The <span style="font-weight: bold;">first </span>line defines the name of the phenotype.</li> | + | <li>The <span style="font-weight: bold;">first </span>line defines the name of the phenotype; for example, #AFFX-BIOB-5_st.</li> |
| − | <li>The <span style="font-weight: bold;">second </span>line contains a value for each sample in the .gct file. Typically, your word processor wraps the second line of the phenotype definition, as shown in the | + | <li>The <span style="font-weight: bold;">second </span>line contains a value for each sample in the .gct file. Typically, your word processor wraps the second line of the phenotype definition, as shown in the example.</li> |
</ul> | </ul> | ||
| − | + | <br /> | |
| − | + | <span style="font-size: 9pt; font-family: Arial;">For a continuous phenotype label, the values for the samples define the phenotype profile</span>. The relative change in the values defines the relative distance between points in the phenotype profile. In the example shown above, the sample values for the two phenotype labels are gene expression values. <span style="font-size: 9pt; font-family: Arial;">The phenotype profile is the expression profile for a gene and is used to find gene sets correlated with that gene. For a time series experiment, you would choose sample values </span>that define the desired expression profile. The example shown below assumes that you have five samples taken at 30 minute intervals. The first phenotype label defines a phenotype profile that shows steadily increasing gene expression; the second defines a profile that shows an initial peak and then gradual decrease: | |
| + | <p class="MsoListContinue2" style="font-family: courier new;">#numeric<br /> | ||
| + | #IncreasingProfle<br /> | ||
| + | 30 60 90 120 150<br /> | ||
| + | #PeakProfle<br /> | ||
| + | 5 20 15 10 5</p> | ||
<h1>Gene Set Database Formats</h1> | <h1>Gene Set Database Formats</h1> | ||
| − | <p class="MsoNormal"><strong style="">Note</strong>: Typically, you use the GMX or GMT formats to define gene sets.<br /></p> | + | <p class="MsoNormal"><strong style="">Note</strong>: Typically, you use the GMX or GMT formats to define gene sets.<br /> |
| + | </p> | ||
<h2>GMX: Gene MatriX file format (*.gmx)</h2> | <h2>GMX: Gene MatriX file format (*.gmx)</h2> | ||
<p class="MsoNormal">The GMX file format is a tab delimited file format that describes gene sets. In the GMX format, each column represents a gene set; in the GMT format, each row represents a gene set. The GMX file format is organized as follows:</p> | <p class="MsoNormal">The GMX file format is a tab delimited file format that describes gene sets. In the GMX format, each column represents a gene set; in the GMT format, each row represents a gene set. The GMX file format is organized as follows:</p> | ||
| Line 77: | Line 136: | ||
<p class="MsoNormal">The GRP files contain a single gene set in a simple newline-delimited text format. Typically, you use the GMT or GMX file formats to create gene sets, rather than using the GRP file format. The GRP file format is organized as follows:</p> | <p class="MsoNormal">The GRP files contain a single gene set in a simple newline-delimited text format. Typically, you use the GMT or GMX file formats to create gene sets, rather than using the GRP file format. The GRP file format is organized as follows:</p> | ||
<p class="MsoNormal">[[image:grp_format_snapshot.gif]]</p> | <p class="MsoNormal">[[image:grp_format_snapshot.gif]]</p> | ||
| − | <h2> | + | <h2>XML: Molecular signature database file format (msigdb_*.xml)</h2> |
<p class="MsoNormal" style="margin-bottom: 12pt;">The MDB files contain an entire gene set database. Unlike the gmt/gmx files, the MDB files are designed to contain rich annotation about a gene set. They are xml formatted file based on the MSigDB Document Type Definition (DTD). Following is the MSigDB DTD and a sample MDB file based on that DTD.</p> | <p class="MsoNormal" style="margin-bottom: 12pt;">The MDB files contain an entire gene set database. Unlike the gmt/gmx files, the MDB files are designed to contain rich annotation about a gene set. They are xml formatted file based on the MSigDB Document Type Definition (DTD). Following is the MSigDB DTD and a sample MDB file based on that DTD.</p> | ||
<p class="MsoNormal"><strong>MSigDB DTD:</strong></p> | <p class="MsoNormal"><strong>MSigDB DTD:</strong></p> | ||
| Line 85: | Line 144: | ||
<h1>Microarray Chip Annotation Formats</h1> | <h1>Microarray Chip Annotation Formats</h1> | ||
<h2>CHIP: Chip file format (*.chip) </h2> | <h2>CHIP: Chip file format (*.chip) </h2> | ||
| − | <p class="MsoNormal">The CHIP file contains annotation about a microarray. It should list the features (i.e probe sets) used in the microarray along with their mapping to gene symbols (when available). While this file is not used directly in the GSEA algorithm, it is used to annotate the output results and may also be used to collapse each probe set in the expression dataset to a single gene vector. </p> | + | <p class="MsoNormal">The CHIP file contains annotation about a microarray. It should list the features (i.e probe sets) used in the microarray along with their mapping to gene symbols (when available). While this file is not used directly in the GSEA algorithm, it is used to annotate the output results and may also be used to collapse each probe set in the expression dataset to a single gene vector.</p> |
| − | <p class="MsoNormal">[[image:chip_format_snapshot.gif]]</p> | + | <p class="MsoNormal">The CHIP file format is organized as follows:</p><br/> |
| − | < | + | <p class="MsoNormal">[[image:chip_format_snapshot.gif]]</p><br/> |
| − | <p class="MsoNormal">The | + | <p class="MsoNormal">The file name must end with .chip extension.</p> |
| + | <p class="MsoNormal">The <strong style="">first line</strong> contains column headings that identify the content of each column in the remainder of the file. The file must contain three column headings separated by tabs: | ||
| + | <li>Probe Set ID | ||
| + | <li>Gene Symbol | ||
| + | <li>Gene Title | ||
| + | </p> | ||
| + | <p class="MsoNormal">The GENE_SYMBOL.chip file contains one additional column, Aliases, which is not shown here. When a gene is identified by more than one HUGO gene symbol, the Gene Symbol column contains the gene symbol that appears in the GSEA reports and the Alias column identifies other gene symbols used to reference the same gene. If a gene set or chip annotation file contains a gene in the Alias column, GSEA automatically converts it to the gene in the Gene Symbol column.</p> | ||
| + | <p class="MsoNormal">The <strong style="">rest of the file</strong> contains data for each probe set ID used in the microarray.</p> | ||
| + | <p class="MsoNormal">Line format: (probe set id) (tab) (gene symbol) (tab) (gene title)</p> | ||
| + | |||
<h1>Ranked Gene Lists</h1> | <h1>Ranked Gene Lists</h1> | ||
<h2>RNK: Ranked list file format (*.rnk)</h2> | <h2>RNK: Ranked list file format (*.rnk)</h2> | ||
| − | <p class="MsoNormal">The RNK file contains a single, rank ordered gene list (<em>not</em> gene set) in a simple newline-delimited text format. It is used when you have a pre-ordered ranked list that you want to analyze with GSEA. For instance, you might have used your favorite tTest-like statistic to produce a ranked ordered gene list from your dataset which you now want to test for enrichment. </p> | + | <p class="MsoNormal">The RNK file contains a single, rank ordered gene list (<em>not</em> gene set) in a simple newline-delimited text format. It is used when you have a pre-ordered ranked list that you want to analyze with GSEA. For instance, you might have used your favorite tTest-like statistic to produce a ranked ordered gene list from your dataset which you now want to test for enrichment. Order of lines does not matter. It is important, however, that the second column will have numeric values - they will be used to rank order genes by GSEA. </p> |
<p class="MsoNormal">[[image:rnk_format_snapshot.gif]]</p> | <p class="MsoNormal">[[image:rnk_format_snapshot.gif]]</p> | ||
Revision as of 23:01, 23 October 2019
GSEA Home |
Downloads |
Molecular Signatures Database |
Documentation |
Contact
Each GSEA supported file is an ASCII text file with a specific format, as described below. For sample data sets, click here.
To create and edit GSEA files, use Excel or a text editor. If you are using Excel:
- Be aware that Excel's auto-formatting can introduce errors in gene names, as described in Zeeberg, et al 2004.
- To create a tab-delimited text file: select File>Save As, enter the file name in quotes to preserve the the file extension (for example, "p53.gct"), and select "Text(Tab delimited)(*.txt)" as the file type. Excel displays a message warning you that your file may contain features that are not compatible with this format and asks if you want to keep the workbook in this format. Click Yes to keep this format. Your file has now been saved. Exit from Excel. When Excel asks if you want to save your changes to this file, select No (you have already saved the file).
When creating files for GSEA, do not use hypens (-) in the file names. Due to restrictions imposed by certain Java libraries used by GSEA, the GSEA command line cannot accept file names that contain hypens.
Contents
Expression Data Formats
Note: The GCT & RES expression formats supported by GSEA are identical to those supported by GenePattern.
GCT: Gene Cluster Text file format (*.gct)
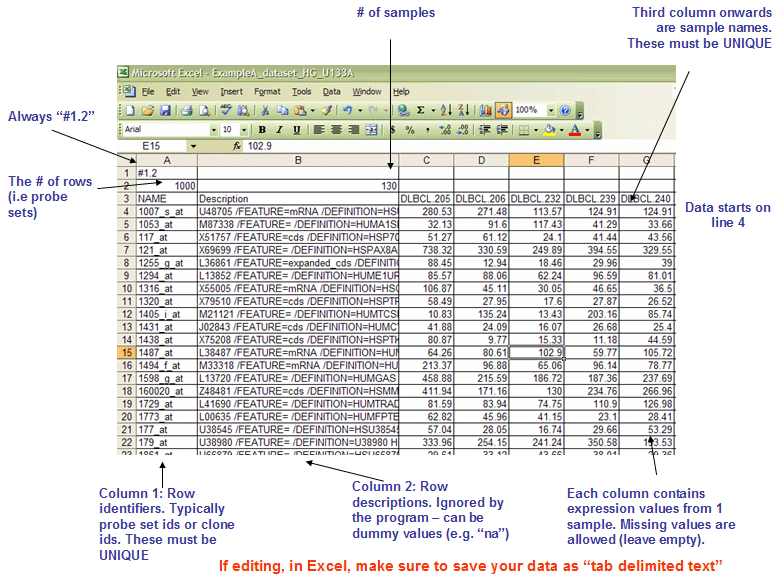
The GCT format is a tab delimited file format that describes an expression dataset. It is organized as follows:
The first line contains the version string and is always the same for this file format. Therefore, the first line must be as follows:
#1.2The second line contains numbers indicating the size of the data table that is contained in the remainder of the file. Note that the name and description columns are not included in the number of data columns.
Line format: (# of data rows) (tab) (# of data columns)
Example:
7129 58
The third line contains a list of identifiers for the samples associated with each of the columns in the remainder of the file.
Line format: Name(tab)Description(tab)(sample 1 name)(tab)(sample 2 name) (tab) ... (sample N name)
Example:
Name Description DLBC1_1 DLBC2_1 ... DLBC58_0
The remainder of the data file contains data for each of the genes. There is one row for each gene and one column for each of the samples. The number of rows and columns should agree with the number of rows and columns specified on line 2. Each row contains a name, a description, and an intensity value for each sample. Names and descriptions can contain spaces, but may not be empty. If no description is available, enter a text string such as NA or NULL. Intensity values may be missing. To specify a missing intensity value, leave the field empty: ...(tab)(tab)....
Line format: (gene name) (tab) (gene description) (tab) (col 1 data) (tab) (col 2 data) (tab) ... (col N data)Example:
AFFX-BioB-5_at AFFX-BioB-5_at (endogenous control) -104 -152 -158 ... -44
Example file: P53_hgu95av2.gct
RES: ExpRESsion (with P and A calls) file format (*.res)
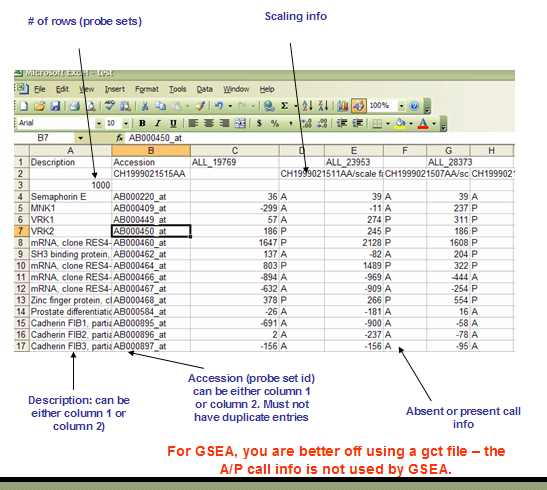
The RES file format is a tab delimited file format that describes an expression dataset. It is organized as follows. The main difference between RES and GCT file formats is the RES file format contains labels for each gene's absent (A) versus present (P) calls as generated by Affymetrix's GeneChip software.
The first line contains a list of labels identifying the samples associated with each of the columns in the remainder of the file. Two tabs (\t\t) separate the sample identifier labels because each sample contains two data values (an expression value and a present/marginal/absent call).
Line format: Description (tab) Accession (tab) (sample 1 name) (tab) (tab) (sample 2 name) (tab) (tab) ... (sample N name)
For example: Description Accession DLBC1_1 DLBC2_1 ... DLBC58_0
The second line contains a list of sample descriptions. Currently, GSEA ignores these descriptions. Our RES file creation tool places the sample data file name and scale factors in this row, as shown below.
Line format: (tab) (sample 1 description) (tab) (tab) (sample 2 description) (tab) (tab) ... (sample N description)
Example: MG2000062219AA MG2000062256AA/scale factor=1.2172 ... MG2000062211AA/scale factor=1.1214
The third line contains a number indicating the number of rows in the data table that is contained in the remainder of the file. Note that the name and description columns are not included in the number of data columns.
Line format: (# of data rows)
For example: 7129
The remainder of the data file contains data for each of the genes. There is one row for each gene and two columns for each of the samples. The first two fields in the row contain the description and name for each of the genes (names and descriptions can contain spaces since fields are separated by tabs). The description field is optional but the tab following it is not. Each sample has two pieces of data associated with it: an expression value and an associated Absent/Marginal/Present (A/M/P) call. The A/M/P calls are generated by microarray scanning software (such as Affymetrix's GeneChip software) and are an indication of the confidence in the measured expression value. Currently, GSEA ignores the Absent/Marginal/Present call.
Line format: (gene description) (tab) (gene name) (tab) (sample 1 data) (tab) (sample 1 A/P call) (tab) (sample 2 data) (tab) (sample 2 A/P call) (tab) ... (sample N data) (tab) (sample N A/P call)
For example: AFFX-BioB-5_at (endogenous control) AFFX-BioB-5_at -104 A -152 A ... -44 A
PCL: Stanford cDNA file format (*.pcl)
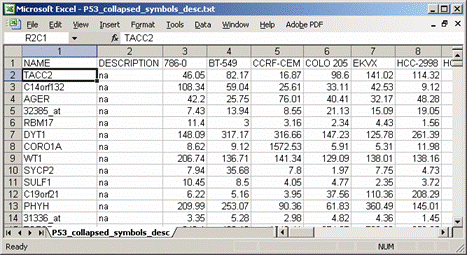
The PCL file format is a tab delimited file format that describes an expression dataset. It is organized as follows. Support for this format is provided because several Stanford cDNA datasets are available in the PCL format. For more information, see Stanford pcl file format.
TXT: Text file format for expression dataset (*.txt)
The TXT format is a tab delimited file format that describes an expression dataset. It is organized as follows:
The first line contains the labels Name and Description followed by the identifiers for each sample in the dataset. NOTE: The Description column is intended to be optional, but there is currently a bug such that it is treated as required. We hope to fix this in a future release. If you have no descriptions available, a value of NA will suffice.
Line format: Name(tab)Description(tab)(sample 1 name)(tab)(sample 2 name) (tab) ... (sample N name)
Example:
Name Description DLBC1_1 DLBC2_1 ... DLBC58_0
The remainder of the file contains data for each of the genes. There is one line for each gene. Each line contains the gene name, gene description, and a value for each sample in the dataset.
Gene names and descriptions can contain spaces since fields are separated by tabs.
Phenotype Data Formats
CLS: Categorical (e.g tumor vs normal) class file format (*.cls)
The CLS file format defines phenotype (class or template) labels and associates each sample in the expression data with a label. The CLS file format uses spaces or tabs to separate the fields.
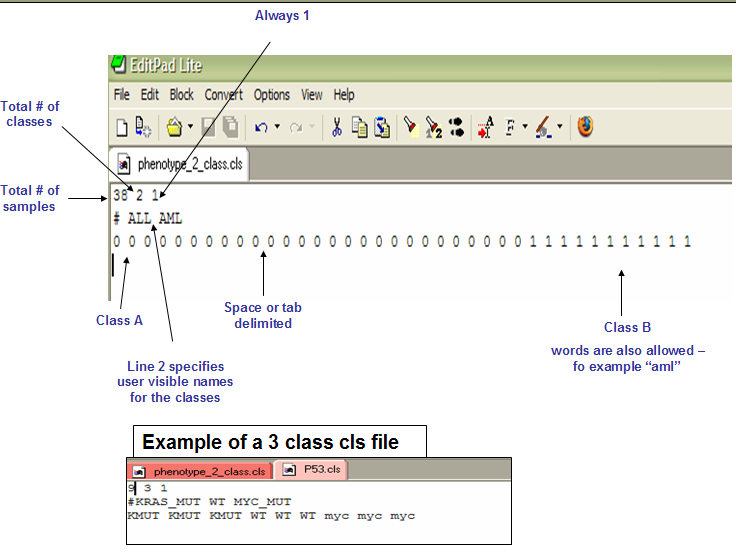
The CLS file format differs somewhat depending on whether you are defining categorical or continuous phenotypes. Categorical labels define discrete phenotypes; for example, normal vs tumor. For categorical labels, the CLS file format is organized as follows:
The first line of a CLS file contains numbers indicating the number of samples and number of classes. The number of samples should correspond to the number of samples in the associated RES or GCT data file.
Line format: (number of samples) (space) (number of classes) (space) 1
Example: 58 2 1
The second line in a CLS file contains a user-visible name for each class. These are the class names that appear in analysis reports. The line should begin with a pound sign (#) followed by a space.
Line format: # (space) (class 0 name) (space) (class 1 name)
Example: # cured fatal/ref
The third line contains a class label for each sample. The class label can be the class name, a number, or a text string. The first label used is assigned to the first class named on the second line; the second unique label is assigned to the second class named; and so on. The number of class labels specified on this line should be the same as the number of samples specified in the first line. The number of unique class labels specified on this line should be the same as the number of classes specified in the first line.
Note: The order of the labels on the third line determines the association of class names and class labels, even if the class labels are the same as the class names and even if the labels are numbers. The key point is that as the third line is processed left-to-right, it will take the first label it finds no matter what it is and map it to the first class name from the second line (also left-to-right). Any other instances of that label then map to that same name.
After that, the second label found (on the third line) different from the first is mapped to the second name (on the second line), and likewise for any other instances. If there are more unique labels than there are names then you'll get an error.
Since the third line represents your samples column-wise as they appear in the expression dataset, you need to arrange the class names on the second line in the order in which they're first encountered among your samples. If you're also using numbers for labels, then you should encounter [0, 1, 2, ...] in order on the third line when reading left-to-right.
Line format: (sample 1 class) (space) (sample 2 class) (space) ... (sample N class)
Example: 0 0 0 ... 1 1
Example file: P53.cls
CLS: Continuous (e.g time-series or gene profile) file format (*.cls)
The CLS file format defines phenotype (class or template) labels and associates each sample in the expression data with a label. The CLS file format uses spaces or tabs to separate the fields.
The CLS file format differs somewhat depending on whether you are defining categorical or continuous phenotypes. Continuous phenotypes are used for time series experiments or to find gene sets correlated with a gene of interest (gene neighbors). A CLS file for continuous labels can contain one or more labels. The following example shows a CLS file that defines two continuous labels:
#numeric
#AFFX-BioB-5_st
206.0 31.0 252.0 -20.0 -169.0 -66.0 230.0 -23.0 67.0 173.0 -55.0 -20.0 469.0 -201.0 -117.0 -162.0 -5.0 -86.0 350.0 74.0 -215.0 193.0 506.0 183.0 350.0 113.0 -17.0 29.0 247.0 -131.0 358.0 561.0 24.0 524.0 167.0 -56.0 176.0 320.0
#AFFX-BioDn-5
75.0 142.0 32.0 109.0 -38.0 -80.0 62.0 39.0 196.0 -42.0 199.0 49.0 171.0 327.0 115.0 -71.0 85.0 80.0 270.0 182.0 208.0 -94.0 292.0 233.0 34.0 0.0 59.0 233.0 48.0 466.0 -7.0 -96.0 297.0 38.0 208.0 -15.0 30.0 357.0
The first line contains the text "#numeric" which indicates that the file defines continuous labels.
The remainder of the file defines the continuous phenotypes. For each phenotype:
- The first line defines the name of the phenotype; for example, #AFFX-BIOB-5_st.
- The second line contains a value for each sample in the .gct file. Typically, your word processor wraps the second line of the phenotype definition, as shown in the example.
For a continuous phenotype label, the values for the samples define the phenotype profile. The relative change in the values defines the relative distance between points in the phenotype profile. In the example shown above, the sample values for the two phenotype labels are gene expression values. The phenotype profile is the expression profile for a gene and is used to find gene sets correlated with that gene. For a time series experiment, you would choose sample values that define the desired expression profile. The example shown below assumes that you have five samples taken at 30 minute intervals. The first phenotype label defines a phenotype profile that shows steadily increasing gene expression; the second defines a profile that shows an initial peak and then gradual decrease:
#numeric
- IncreasingProfle
30 60 90 120 150
- PeakProfle
5 20 15 10 5
Gene Set Database Formats
Note: Typically, you use the GMX or GMT formats to define gene sets.
GMX: Gene MatriX file format (*.gmx)
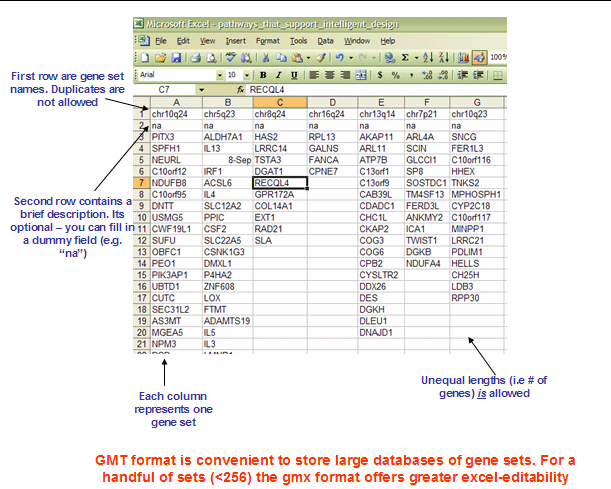
The GMX file format is a tab delimited file format that describes gene sets. In the GMX format, each column represents a gene set; in the GMT format, each row represents a gene set. The GMX file format is organized as follows:
Each gene set is described by a name, a description, and the genes in the gene set. GSEA uses the description field to determine what hyperlink to provide in the report for the gene set description: if the description is “na”, GSEA provides a link to the named gene set in MSigDB; if the description is a URL, GSEA provides a link to that URL.
GMT: Gene Matrix Transposed file format (*.gmt)
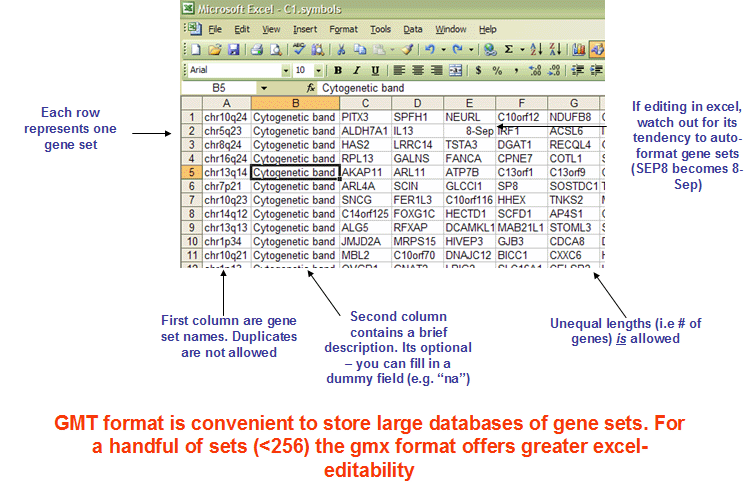
The GMT file format is a tab delimited file format that describes gene sets. In the GMT format, each row represents a gene set; in the GMX format, each column represents a gene set. The GMT file format is organized as follows:
Each gene set is described by a name, a description, and the genes in the gene set. GSEA uses the description field to determine what hyperlink to provide in the report for the gene set description: if the description is “na”, GSEA provides a link to the named gene set in MSigDB; if the description is a URL, GSEA provides a link to that URL.
GRP: Gene set file format (*.grp)
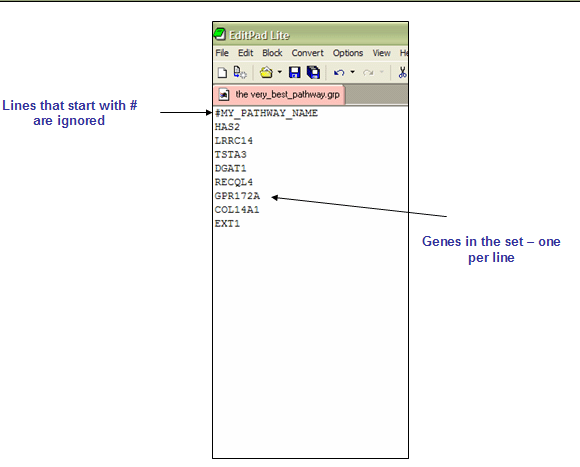
The GRP files contain a single gene set in a simple newline-delimited text format. Typically, you use the GMT or GMX file formats to create gene sets, rather than using the GRP file format. The GRP file format is organized as follows:
XML: Molecular signature database file format (msigdb_*.xml)
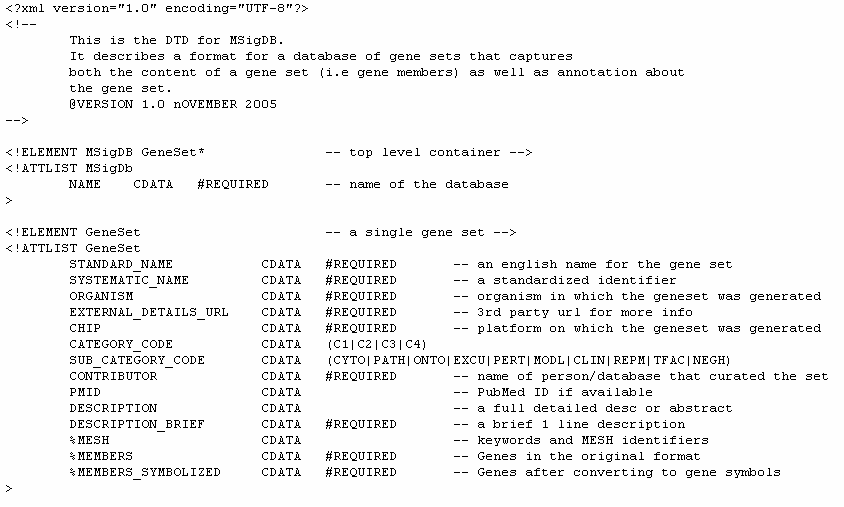
The MDB files contain an entire gene set database. Unlike the gmt/gmx files, the MDB files are designed to contain rich annotation about a gene set. They are xml formatted file based on the MSigDB Document Type Definition (DTD). Following is the MSigDB DTD and a sample MDB file based on that DTD.
MSigDB DTD:
Example of an MSigDB xml formatted file:
Microarray Chip Annotation Formats
CHIP: Chip file format (*.chip)
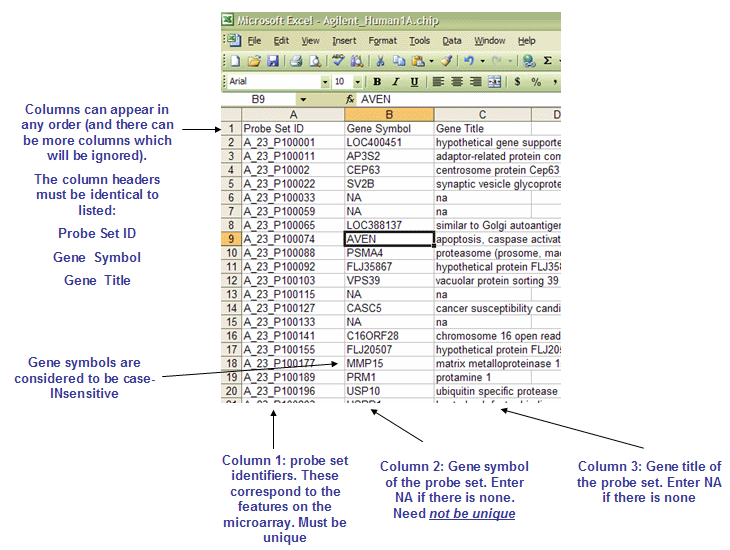
The CHIP file contains annotation about a microarray. It should list the features (i.e probe sets) used in the microarray along with their mapping to gene symbols (when available). While this file is not used directly in the GSEA algorithm, it is used to annotate the output results and may also be used to collapse each probe set in the expression dataset to a single gene vector.
The CHIP file format is organized as follows:
The file name must end with .chip extension.
The first line contains column headings that identify the content of each column in the remainder of the file. The file must contain three column headings separated by tabs:
The GENE_SYMBOL.chip file contains one additional column, Aliases, which is not shown here. When a gene is identified by more than one HUGO gene symbol, the Gene Symbol column contains the gene symbol that appears in the GSEA reports and the Alias column identifies other gene symbols used to reference the same gene. If a gene set or chip annotation file contains a gene in the Alias column, GSEA automatically converts it to the gene in the Gene Symbol column.
The rest of the file contains data for each probe set ID used in the microarray.
Line format: (probe set id) (tab) (gene symbol) (tab) (gene title)
Ranked Gene Lists
RNK: Ranked list file format (*.rnk)
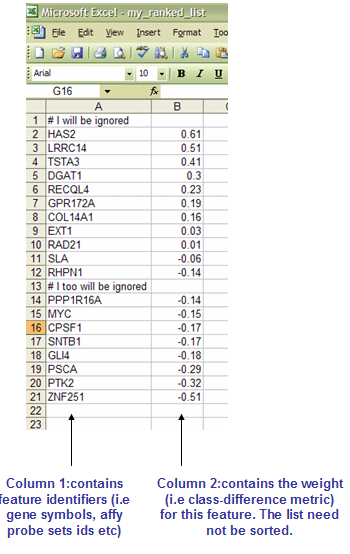
The RNK file contains a single, rank ordered gene list (not gene set) in a simple newline-delimited text format. It is used when you have a pre-ordered ranked list that you want to analyze with GSEA. For instance, you might have used your favorite tTest-like statistic to produce a ranked ordered gene list from your dataset which you now want to test for enrichment. Order of lines does not matter. It is important, however, that the second column will have numeric values - they will be used to rank order genes by GSEA.
