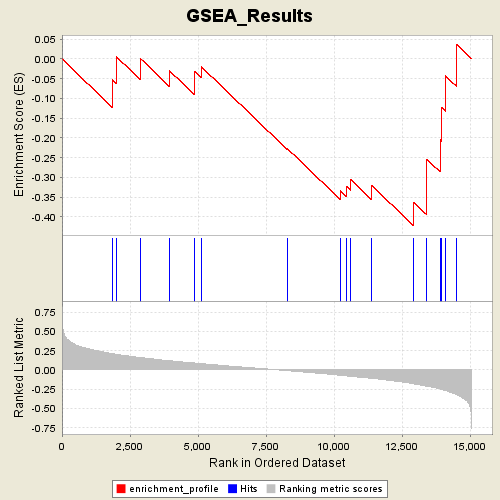
Profile of the Running ES Score & Positions of GeneSet Members on the Rank Ordered List
| Dataset | Diabetes_collapsed.gct |
| Phenotype | DMT |
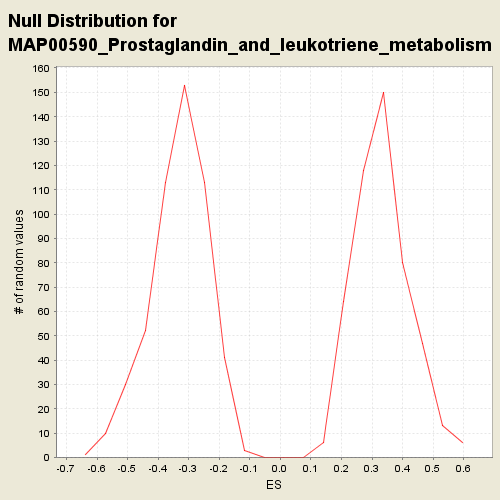
| GeneSet | C2.symbols.gmt#MAP00590_Prostaglandin_and_leukotriene_metabolism |
| Enrichment Score (ES) | -0.42325714 |
| Normalized Enrichment Score (NES) | -1.2761015 |
| Nominal p-value | 0.15891473 |
| FDR q-value | 1.0 |
| FWER p-Value | 1.0 |
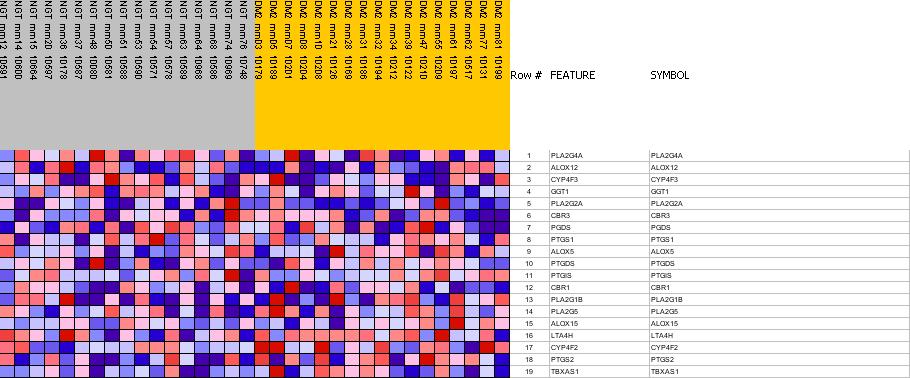
| PROBE | GENE SYMBOL | GENE_TITLE | RANK IN GENE LIST | RANK METRIC SCORE | RES | CORE_ENRICHMENT | |
|---|---|---|---|---|---|---|---|
| 1 | PLA2G4A | PLA2G4A StanfordSource, GeneCards | phospholipase A2, group IVA (cytosolic, calcium-dependent) | 1851 | 0.212 | -0.0524 | No |
| 2 | ALOX12 | ALOX12 StanfordSource, GeneCards | arachidonate 12-lipoxygenase | 2005 | 0.203 | 0.0053 | No |
| 3 | CYP4F3 | CYP4F3 StanfordSource, GeneCards | cytochrome P450, family 4, subfamily F, polypeptide 3 | 2875 | 0.162 | 0.0016 | No |
| 4 | GGT1 | GGT1 StanfordSource, GeneCards | gamma-glutamyltransferase 1 | 3961 | 0.120 | -0.0306 | No |
| 5 | PLA2G2A | PLA2G2A StanfordSource, GeneCards | phospholipase A2, group IIA (platelets, synovial fluid) | 4866 | 0.090 | -0.0605 | No |
| 6 | CBR3 | CBR3 StanfordSource, GeneCards | carbonyl reductase 3 | 4879 | 0.090 | -0.0312 | No |
| 7 | PGDS | PGDS StanfordSource, GeneCards | prostaglandin D2 synthase, hematopoietic | 5123 | 0.082 | -0.0198 | No |
| 8 | PTGS1 | PTGS1 StanfordSource, GeneCards | prostaglandin-endoperoxide synthase 1 (prostaglandin G/H synthase and cyclooxygenase) | 8279 | -0.009 | -0.2268 | No |
| 9 | ALOX5 | ALOX5 StanfordSource, GeneCards | arachidonate 5-lipoxygenase | 10231 | -0.069 | -0.3335 | No |
| 10 | PTGDS | PTGDS StanfordSource, GeneCards | prostaglandin D2 synthase 21kDa (brain) | 10471 | -0.077 | -0.3236 | No |
| 11 | PTGIS | PTGIS StanfordSource, GeneCards | prostaglandin I2 (prostacyclin) synthase | 10613 | -0.082 | -0.3056 | No |
| 12 | CBR1 | CBR1 StanfordSource, GeneCards | carbonyl reductase 1 | 11385 | -0.109 | -0.3205 | No |
| 13 | PLA2G1B | PLA2G1B StanfordSource, GeneCards | phospholipase A2, group IB (pancreas) | 12931 | -0.180 | -0.3631 | Yes |
| 14 | PLA2G5 | PLA2G5 StanfordSource, GeneCards | phospholipase A2, group V | 13410 | -0.211 | -0.3244 | Yes |
| 15 | ALOX15 | ALOX15 StanfordSource, GeneCards | arachidonate 15-lipoxygenase | 13415 | -0.211 | -0.2542 | Yes |
| 16 | LTA4H | LTA4H StanfordSource, GeneCards | leukotriene A4 hydrolase | 13902 | -0.247 | -0.2040 | Yes |
| 17 | CYP4F2 | CYP4F2 StanfordSource, GeneCards | cytochrome P450, family 4, subfamily F, polypeptide 2 | 13966 | -0.254 | -0.1231 | Yes |
| 18 | PTGS2 | PTGS2 StanfordSource, GeneCards | prostaglandin-endoperoxide synthase 2 (prostaglandin G/H synthase and cyclooxygenase) | 14101 | -0.266 | -0.0430 | Yes |
| 19 | TBXAS1 | TBXAS1 StanfordSource, GeneCards | thromboxane A synthase 1 (platelet, cytochrome P450, family 5, subfamily A) | 14498 | -0.318 | 0.0370 | Yes |