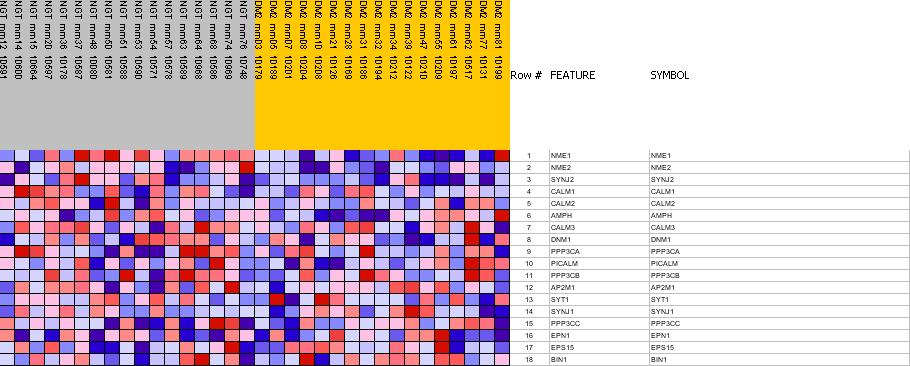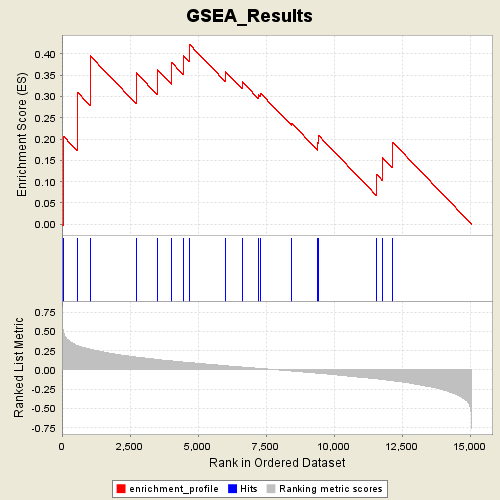
Profile of the Running ES Score & Positions of GeneSet Members on the Rank Ordered List
| Dataset | Diabetes_collapsed.gct |
| Phenotype | NGT |
| GeneSet | C2.symbols.gmt#ndkDynaminPathway |
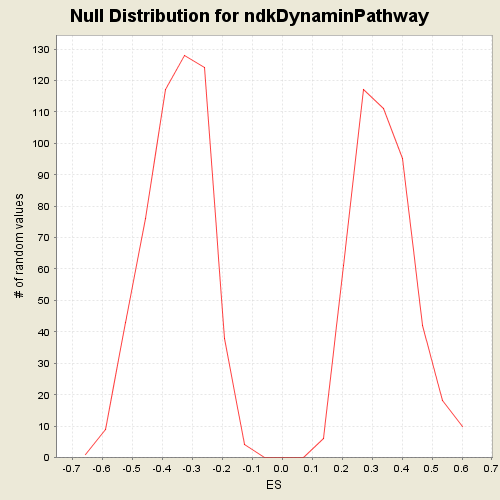
| Enrichment Score (ES) | 0.42272267 |
| Normalized Enrichment Score (NES) | 1.2453045 |
| Nominal p-value | 0.18695652 |
| FDR q-value | 1.0 |
| FWER p-Value | 1.0 |
| PROBE | GENE SYMBOL | GENE_TITLE | RANK IN GENE LIST | RANK METRIC SCORE | RES | CORE_ENRICHMENT | |
|---|---|---|---|---|---|---|---|
| 1 | NME1 | NME1 StanfordSource, GeneCards | non-metastatic cells 1, protein (NM23A) expressed in | 64 | 0.483 | 0.2057 | Yes |
| 2 | NME2 | NME2 StanfordSource, GeneCards | non-metastatic cells 2, protein (NM23B) expressed in | 568 | 0.317 | 0.3100 | Yes |
| 3 | SYNJ2 | SYNJ2 StanfordSource, GeneCards | synaptojanin 2 | 1036 | 0.268 | 0.3955 | Yes |
| 4 | CALM1 | CALM1 StanfordSource, GeneCards | calmodulin 1 (phosphorylase kinase, delta) | 2731 | 0.167 | 0.3556 | Yes |
| 5 | CALM2 | CALM2 StanfordSource, GeneCards | calmodulin 2 (phosphorylase kinase, delta) | 3499 | 0.137 | 0.3641 | Yes |
| 6 | AMPH | AMPH StanfordSource, GeneCards | amphiphysin (Stiff-Man syndrome with breast cancer 128kDa autoantigen) | 4027 | 0.118 | 0.3802 | Yes |
| 7 | CALM3 | CALM3 StanfordSource, GeneCards | calmodulin 3 (phosphorylase kinase, delta) | 4463 | 0.102 | 0.3958 | Yes |
| 8 | DNM1 | DNM1 StanfordSource, GeneCards | dynamin 1 | 4685 | 0.096 | 0.4227 | Yes |
| 9 | PPP3CA | PPP3CA StanfordSource, GeneCards | protein phosphatase 3 (formerly 2B), catalytic subunit, alpha isoform (calcineurin A alpha) | 6009 | 0.055 | 0.3588 | No |
| 10 | PICALM | PICALM StanfordSource, GeneCards | phosphatidylinositol binding clathrin assembly protein | 6621 | 0.038 | 0.3348 | No |
| 11 | PPP3CB | PPP3CB StanfordSource, GeneCards | protein phosphatase 3 (formerly 2B), catalytic subunit, beta isoform (calcineurin A beta) | 7216 | 0.021 | 0.3046 | No |
| 12 | AP2M1 | AP2M1 StanfordSource, GeneCards | adaptor-related protein complex 2, mu 1 subunit | 7294 | 0.019 | 0.3080 | No |
| 13 | SYT1 | SYT1 StanfordSource, GeneCards | synaptotagmin I | 8437 | -0.013 | 0.2377 | No |
| 14 | SYNJ1 | SYNJ1 StanfordSource, GeneCards | synaptojanin 1 | 9411 | -0.042 | 0.1912 | No |
| 15 | PPP3CC | PPP3CC StanfordSource, GeneCards | protein phosphatase 3 (formerly 2B), catalytic subunit, gamma isoform (calcineurin A gamma) | 9445 | -0.043 | 0.2076 | No |
| 16 | EPN1 | EPN1 StanfordSource, GeneCards | epsin 1 | 11569 | -0.115 | 0.1166 | No |
| 17 | EPS15 | EPS15 StanfordSource, GeneCards | epidermal growth factor receptor pathway substrate 15 | 11791 | -0.125 | 0.1561 | No |
| 18 | BIN1 | BIN1 StanfordSource, GeneCards | bridging integrator 1 | 12154 | -0.140 | 0.1929 | No |