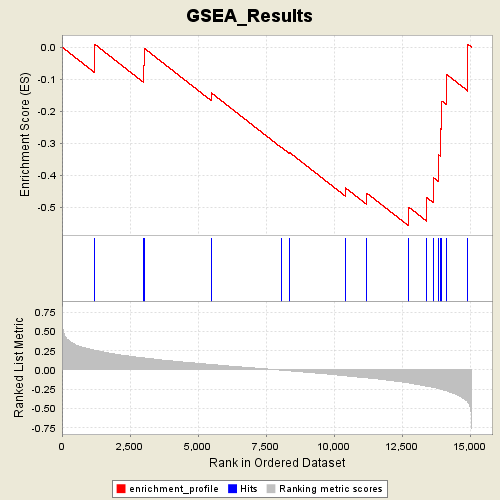
Profile of the Running ES Score & Positions of GeneSet Members on the Rank Ordered List
| Dataset | Diabetes_collapsed.gct |
| Phenotype | DMT |
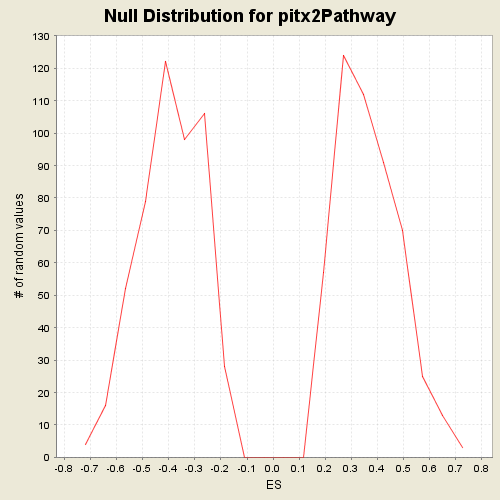
| GeneSet | C2.symbols.gmt#pitx2Pathway |
| Enrichment Score (ES) | -0.5584103 |
| Normalized Enrichment Score (NES) | -1.4260616 |
| Nominal p-value | 0.0990099 |
| FDR q-value | 1.0 |
| FWER p-Value | 0.985 |
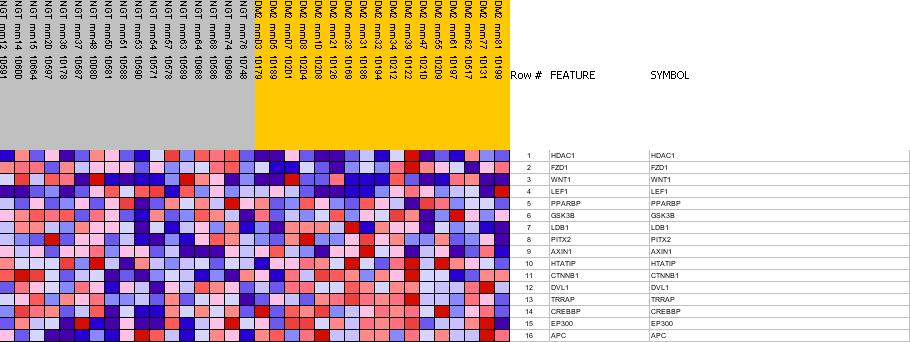
| PROBE | GENE SYMBOL | GENE_TITLE | RANK IN GENE LIST | RANK METRIC SCORE | RES | CORE_ENRICHMENT | |
|---|---|---|---|---|---|---|---|
| 1 | HDAC1 | HDAC1 StanfordSource, GeneCards | histone deacetylase 1 | 1210 | 0.255 | 0.0085 | No |
| 2 | FZD1 | FZD1 StanfordSource, GeneCards | frizzled homolog 1 (Drosophila) | 3013 | 0.156 | -0.0571 | No |
| 3 | WNT1 | WNT1 StanfordSource, GeneCards | wingless-type MMTV integration site family, member 1 | 3044 | 0.155 | -0.0051 | No |
| 4 | LEF1 | LEF1 StanfordSource, GeneCards | lymphoid enhancer-binding factor 1 | 5483 | 0.071 | -0.1424 | No |
| 5 | PPARBP | PPARBP StanfordSource, GeneCards | PPAR binding protein | 8078 | -0.003 | -0.3140 | No |
| 6 | GSK3B | GSK3B StanfordSource, GeneCards | glycogen synthase kinase 3 beta | 8367 | -0.011 | -0.3292 | No |
| 7 | LDB1 | LDB1 StanfordSource, GeneCards | LIM domain binding 1 | 10417 | -0.075 | -0.4392 | No |
| 8 | PITX2 | PITX2 StanfordSource, GeneCards | paired-like homeodomain transcription factor 2 | 11210 | -0.102 | -0.4562 | No |
| 9 | AXIN1 | AXIN1 StanfordSource, GeneCards | axin 1 | 12748 | -0.169 | -0.4996 | Yes |
| 10 | HTATIP | HTATIP StanfordSource, GeneCards | HIV-1 Tat interactive protein, 60kDa | 13418 | -0.211 | -0.4705 | Yes |
| 11 | CTNNB1 | CTNNB1 StanfordSource, GeneCards | catenin (cadherin-associated protein), beta 1, 88kDa | 13645 | -0.226 | -0.4069 | Yes |
| 12 | DVL1 | DVL1 StanfordSource, GeneCards | dishevelled, dsh homolog 1 (Drosophila) | 13827 | -0.241 | -0.3350 | Yes |
| 13 | TRRAP | TRRAP StanfordSource, GeneCards | transformation/transcription domain-associated protein | 13927 | -0.250 | -0.2546 | Yes |
| 14 | CREBBP | CREBBP StanfordSource, GeneCards | CREB binding protein (Rubinstein-Taybi syndrome) | 13969 | -0.255 | -0.1686 | Yes |
| 15 | EP300 | EP300 StanfordSource, GeneCards | E1A binding protein p300 | 14144 | -0.271 | -0.0855 | Yes |
| 16 | APC | APC StanfordSource, GeneCards | adenomatosis polyposis coli | 14925 | -0.419 | 0.0086 | Yes |