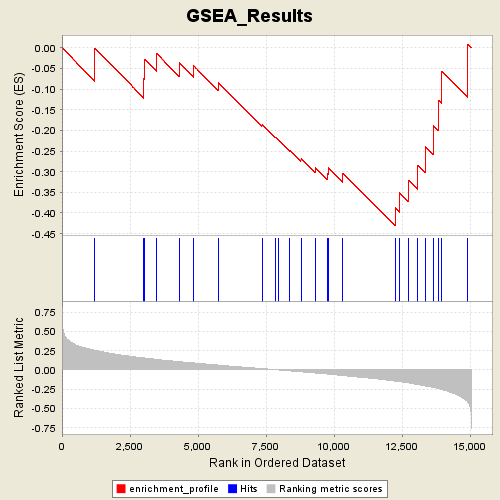
Profile of the Running ES Score & Positions of GeneSet Members on the Rank Ordered List
| Dataset | Diabetes_collapsed.gct |
| Phenotype | DMT |
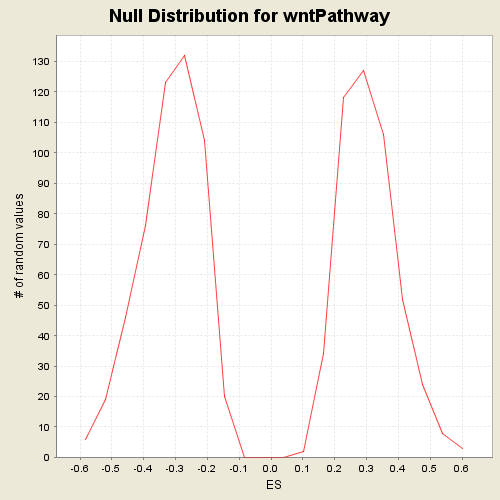
| GeneSet | C2.symbols.gmt#wntPathway |
| Enrichment Score (ES) | -0.43149593 |
| Normalized Enrichment Score (NES) | -1.3680822 |
| Nominal p-value | 0.12547529 |
| FDR q-value | 1.0 |
| FWER p-Value | 0.989 |
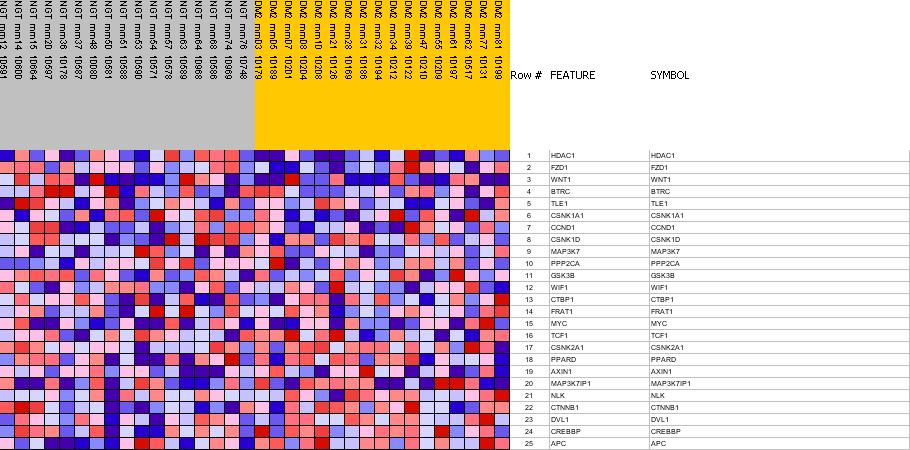
| PROBE | GENE SYMBOL | GENE_TITLE | RANK IN GENE LIST | RANK METRIC SCORE | RES | CORE_ENRICHMENT | |
|---|---|---|---|---|---|---|---|
| 1 | HDAC1 | HDAC1 StanfordSource, GeneCards | histone deacetylase 1 | 1210 | 0.255 | -0.0017 | No |
| 2 | FZD1 | FZD1 StanfordSource, GeneCards | frizzled homolog 1 (Drosophila) | 3013 | 0.156 | -0.0735 | No |
| 3 | WNT1 | WNT1 StanfordSource, GeneCards | wingless-type MMTV integration site family, member 1 | 3044 | 0.155 | -0.0277 | No |
| 4 | BTRC | BTRC StanfordSource, GeneCards | beta-transducin repeat containing | 3474 | 0.138 | -0.0135 | No |
| 5 | TLE1 | TLE1 StanfordSource, GeneCards | transducin-like enhancer of split 1 (E(sp1) homolog, Drosophila) | 4312 | 0.107 | -0.0362 | No |
| 6 | CSNK1A1 | CSNK1A1 StanfordSource, GeneCards | casein kinase 1, alpha 1 | 4832 | 0.091 | -0.0426 | No |
| 7 | CCND1 | CCND1 StanfordSource, GeneCards | cyclin D1 (PRAD1: parathyroid adenomatosis 1) | 5757 | 0.064 | -0.0844 | No |
| 8 | CSNK1D | CSNK1D StanfordSource, GeneCards | casein kinase 1, delta | 7353 | 0.018 | -0.1851 | No |
| 9 | MAP3K7 | MAP3K7 StanfordSource, GeneCards | mitogen-activated protein kinase kinase kinase 7 | 7850 | 0.004 | -0.2169 | No |
| 10 | PPP2CA | PPP2CA StanfordSource, GeneCards | protein phosphatase 2 (formerly 2A), catalytic subunit, alpha isoform | 7974 | 0.000 | -0.2249 | No |
| 11 | GSK3B | GSK3B StanfordSource, GeneCards | glycogen synthase kinase 3 beta | 8367 | -0.011 | -0.2476 | No |
| 12 | WIF1 | WIF1 StanfordSource, GeneCards | WNT inhibitory factor 1 | 8787 | -0.023 | -0.2684 | No |
| 13 | CTBP1 | CTBP1 StanfordSource, GeneCards | C-terminal binding protein 1 | 9305 | -0.039 | -0.2907 | No |
| 14 | FRAT1 | FRAT1 StanfordSource, GeneCards | frequently rearranged in advanced T-cell lymphomas | 9745 | -0.052 | -0.3040 | No |
| 15 | MYC | MYC StanfordSource, GeneCards | v-myc myelocytomatosis viral oncogene homolog (avian) | 9783 | -0.053 | -0.2899 | No |
| 16 | TCF1 | TCF1 StanfordSource, GeneCards | transcription factor 1, hepatic; LF-B1, hepatic nuclear factor (HNF1), albumin proximal factor | 10323 | -0.072 | -0.3036 | No |
| 17 | CSNK2A1 | CSNK2A1 StanfordSource, GeneCards | casein kinase 2, alpha 1 polypeptide | 12246 | -0.145 | -0.3868 | Yes |
| 18 | PPARD | PPARD StanfordSource, GeneCards | peroxisome proliferative activated receptor, delta | 12417 | -0.152 | -0.3512 | Yes |
| 19 | AXIN1 | AXIN1 StanfordSource, GeneCards | axin 1 | 12748 | -0.169 | -0.3210 | Yes |
| 20 | MAP3K7IP1 | MAP3K7IP1 StanfordSource, GeneCards | mitogen-activated protein kinase kinase kinase 7 interacting protein 1 | 13086 | -0.189 | -0.2851 | Yes |
| 21 | NLK | NLK StanfordSource, GeneCards | nemo-like kinase | 13346 | -0.206 | -0.2386 | Yes |
| 22 | CTNNB1 | CTNNB1 StanfordSource, GeneCards | catenin (cadherin-associated protein), beta 1, 88kDa | 13645 | -0.226 | -0.1888 | Yes |
| 23 | DVL1 | DVL1 StanfordSource, GeneCards | dishevelled, dsh homolog 1 (Drosophila) | 13827 | -0.241 | -0.1265 | Yes |
| 24 | CREBBP | CREBBP StanfordSource, GeneCards | CREB binding protein (Rubinstein-Taybi syndrome) | 13969 | -0.255 | -0.0572 | Yes |
| 25 | APC | APC StanfordSource, GeneCards | adenomatosis polyposis coli | 14925 | -0.419 | 0.0086 | Yes |