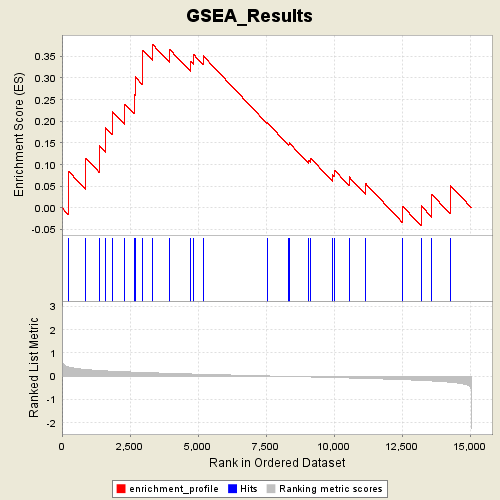
Profile of the Running ES Score & Positions of GeneSet Members on the Rank Ordered List
| Dataset | Gender_collapsed.gct |
| Phenotype | MALE |
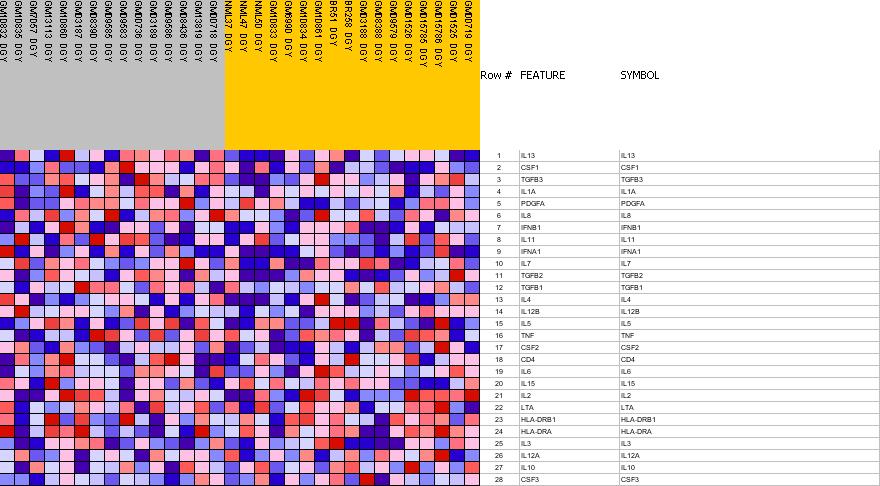
| GeneSet | C2.symbols.gmt#inflamPathway |
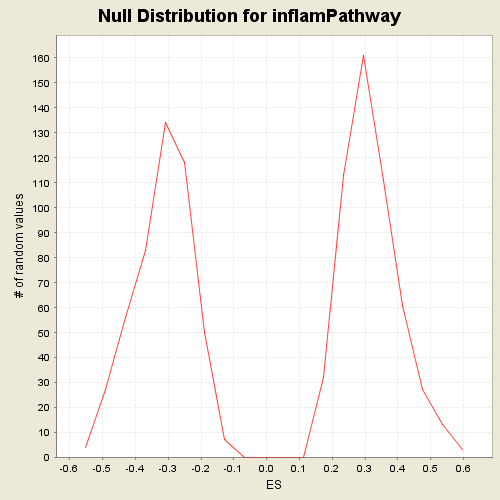
| Enrichment Score (ES) | 0.3775516 |
| Normalized Enrichment Score (NES) | 1.1879957 |
| Nominal p-value | 0.21305183 |
| FDR q-value | 1.0 |
| FWER p-Value | 0.978 |
| PROBE | GENE SYMBOL | GENE_TITLE | RANK IN GENE LIST | RANK METRIC SCORE | RES | CORE_ENRICHMENT | |
|---|---|---|---|---|---|---|---|
| 1 | IL13 | IL13 StanfordSource, GeneCards | interleukin 13 | 235 | 0.397 | 0.0849 | Yes |
| 2 | CSF1 | CSF1 StanfordSource, GeneCards | colony stimulating factor 1 (macrophage) | 874 | 0.286 | 0.1149 | Yes |
| 3 | TGFB3 | TGFB3 StanfordSource, GeneCards | transforming growth factor, beta 3 | 1366 | 0.242 | 0.1435 | Yes |
| 4 | IL1A | IL1A StanfordSource, GeneCards | interleukin 1, alpha | 1600 | 0.227 | 0.1854 | Yes |
| 5 | PDGFA | PDGFA StanfordSource, GeneCards | platelet-derived growth factor alpha polypeptide | 1841 | 0.213 | 0.2234 | Yes |
| 6 | IL8 | IL8 StanfordSource, GeneCards | interleukin 8 | 2315 | 0.188 | 0.2396 | Yes |
| 7 | IFNB1 | IFNB1 StanfordSource, GeneCards | interferon, beta 1, fibroblast | 2651 | 0.173 | 0.2612 | Yes |
| 8 | IL11 | IL11 StanfordSource, GeneCards | interleukin 11 | 2690 | 0.172 | 0.3022 | Yes |
| 9 | IFNA1 | IFNA1 StanfordSource, GeneCards | interferon, alpha 1 | 2952 | 0.160 | 0.3253 | Yes |
| 10 | IL7 | IL7 StanfordSource, GeneCards | interleukin 7 | 2976 | 0.159 | 0.3642 | Yes |
| 11 | TGFB2 | TGFB2 StanfordSource, GeneCards | transforming growth factor, beta 2 | 3326 | 0.145 | 0.3776 | Yes |
| 12 | TGFB1 | TGFB1 StanfordSource, GeneCards | transforming growth factor, beta 1 (Camurati-Engelmann disease) | 3963 | 0.119 | 0.3654 | No |
| 13 | IL4 | IL4 StanfordSource, GeneCards | interleukin 4 | 4722 | 0.094 | 0.3387 | No |
| 14 | IL12B | IL12B StanfordSource, GeneCards | interleukin 12B (natural killer cell stimulatory factor 2, cytotoxic lymphocyte maturation factor 2, p40) | 4845 | 0.090 | 0.3535 | No |
| 15 | IL5 | IL5 StanfordSource, GeneCards | interleukin 5 (colony-stimulating factor, eosinophil) | 5187 | 0.080 | 0.3511 | No |
| 16 | TNF | TNF StanfordSource, GeneCards | tumor necrosis factor (TNF superfamily, member 2) | 7548 | 0.010 | 0.1965 | No |
| 17 | CSF2 | CSF2 StanfordSource, GeneCards | colony stimulating factor 2 (granulocyte-macrophage) | 8338 | -0.013 | 0.1474 | No |
| 18 | CD4 | CD4 StanfordSource, GeneCards | CD4 antigen (p55) | 8352 | -0.014 | 0.1499 | No |
| 19 | IL6 | IL6 StanfordSource, GeneCards | interleukin 6 (interferon, beta 2) | 9079 | -0.033 | 0.1099 | No |
| 20 | IL15 | IL15 StanfordSource, GeneCards | interleukin 15 | 9150 | -0.035 | 0.1141 | No |
| 21 | IL2 | IL2 StanfordSource, GeneCards | interleukin 2 | 9946 | -0.059 | 0.0762 | No |
| 22 | LTA | LTA StanfordSource, GeneCards | lymphotoxin alpha (TNF superfamily, member 1) | 10014 | -0.061 | 0.0872 | No |
| 23 | HLA-DRB1 | HLA-DRB1 StanfordSource, GeneCards | major histocompatibility complex, class II, DR beta 1 | 10553 | -0.078 | 0.0712 | No |
| 24 | HLA-DRA | HLA-DRA StanfordSource, GeneCards | major histocompatibility complex, class II, DR alpha | 11172 | -0.100 | 0.0554 | No |
| 25 | IL3 | IL3 StanfordSource, GeneCards | interleukin 3 (colony-stimulating factor, multiple) | 12518 | -0.151 | 0.0040 | No |
| 26 | IL12A | IL12A StanfordSource, GeneCards | interleukin 12A (natural killer cell stimulatory factor 1, cytotoxic lymphocyte maturation factor 1, p35) | 13207 | -0.182 | 0.0044 | No |
| 27 | IL10 | IL10 StanfordSource, GeneCards | interleukin 10 | 13602 | -0.207 | 0.0307 | No |
| 28 | CSF3 | CSF3 StanfordSource, GeneCards | colony stimulating factor 3 (granulocyte) | 14272 | -0.260 | 0.0521 | No |