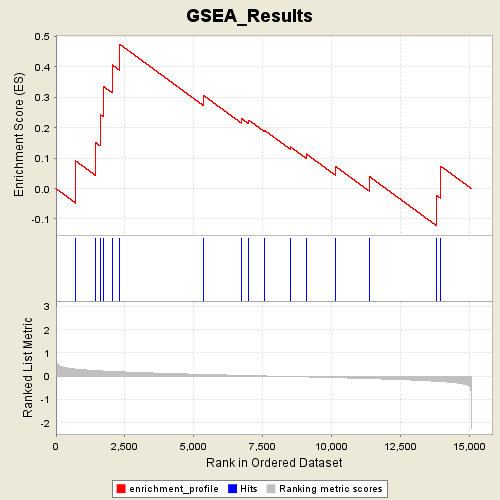
Profile of the Running ES Score & Positions of GeneSet Members on the Rank Ordered List
| Dataset | Gender_collapsed.gct |
| Phenotype | MALE |
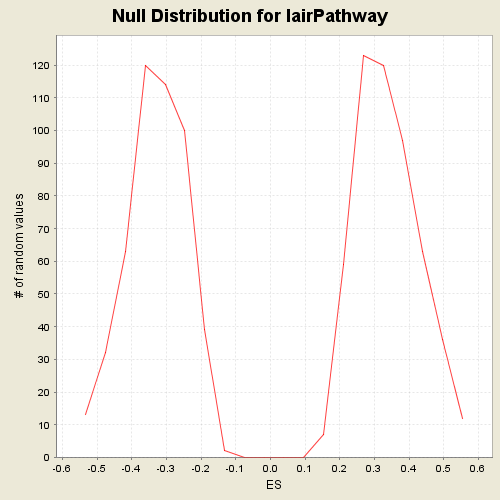
| GeneSet | C2.symbols.gmt#lairPathway |
| Enrichment Score (ES) | 0.47351325 |
| Normalized Enrichment Score (NES) | 1.3977858 |
| Nominal p-value | 0.08704062 |
| FDR q-value | 1.0 |
| FWER p-Value | 0.916 |
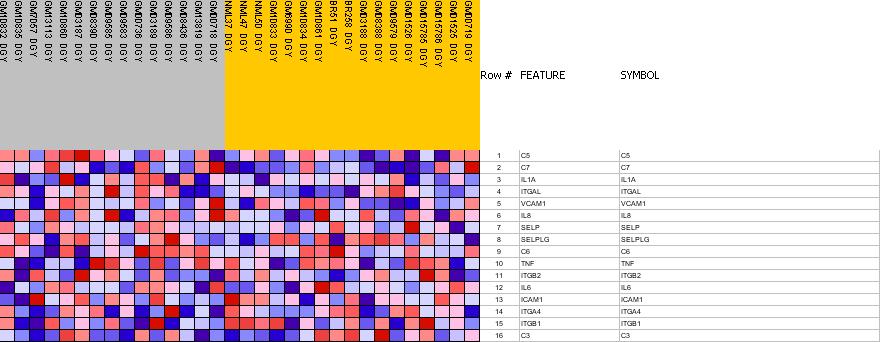
| PROBE | GENE SYMBOL | GENE_TITLE | RANK IN GENE LIST | RANK METRIC SCORE | RES | CORE_ENRICHMENT | |
|---|---|---|---|---|---|---|---|
| 1 | C5 | C5 StanfordSource, GeneCards | complement component 5 | 717 | 0.304 | 0.0906 | Yes |
| 2 | C7 | C7 StanfordSource, GeneCards | complement component 7 | 1434 | 0.237 | 0.1509 | Yes |
| 3 | IL1A | IL1A StanfordSource, GeneCards | interleukin 1, alpha | 1600 | 0.227 | 0.2431 | Yes |
| 4 | ITGAL | ITGAL StanfordSource, GeneCards | integrin, alpha L (antigen CD11A (p180), lymphocyte function-associated antigen 1; alpha polypeptide) | 1724 | 0.220 | 0.3350 | Yes |
| 5 | VCAM1 | VCAM1 StanfordSource, GeneCards | vascular cell adhesion molecule 1 | 2040 | 0.202 | 0.4059 | Yes |
| 6 | IL8 | IL8 StanfordSource, GeneCards | interleukin 8 | 2315 | 0.188 | 0.4735 | Yes |
| 7 | SELP | SELP StanfordSource, GeneCards | selectin P (granule membrane protein 140kDa, antigen CD62) | 5338 | 0.074 | 0.3065 | No |
| 8 | SELPLG | SELPLG StanfordSource, GeneCards | selectin P ligand | 6721 | 0.034 | 0.2303 | No |
| 9 | C6 | C6 StanfordSource, GeneCards | complement component 6 | 6993 | 0.027 | 0.2243 | No |
| 10 | TNF | TNF StanfordSource, GeneCards | tumor necrosis factor (TNF superfamily, member 2) | 7548 | 0.010 | 0.1920 | No |
| 11 | ITGB2 | ITGB2 StanfordSource, GeneCards | integrin, beta 2 (antigen CD18 (p95), lymphocyte function-associated antigen 1; macrophage antigen 1 (mac-1) beta subunit) | 8505 | -0.018 | 0.1365 | No |
| 12 | IL6 | IL6 StanfordSource, GeneCards | interleukin 6 (interferon, beta 2) | 9079 | -0.033 | 0.1134 | No |
| 13 | ICAM1 | ICAM1 StanfordSource, GeneCards | intercellular adhesion molecule 1 (CD54), human rhinovirus receptor | 10130 | -0.065 | 0.0731 | No |
| 14 | ITGA4 | ITGA4 StanfordSource, GeneCards | integrin, alpha 4 (antigen CD49D, alpha 4 subunit of VLA-4 receptor) | 11358 | -0.106 | 0.0398 | No |
| 15 | ITGB1 | ITGB1 StanfordSource, GeneCards | integrin, beta 1 (fibronectin receptor, beta polypeptide, antigen CD29 includes MDF2, MSK12) | 13805 | -0.220 | -0.0224 | No |
| 16 | C3 | C3 StanfordSource, GeneCards | complement component 3 | 13944 | -0.232 | 0.0739 | No |