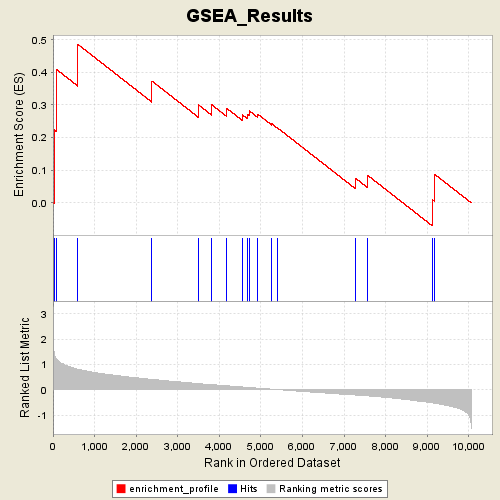
Profile of the Running ES Score & Positions of GeneSet Members on the Rank Ordered List
| Dataset | Leukemia_collapsed.gct |
| Phenotype | ALL |
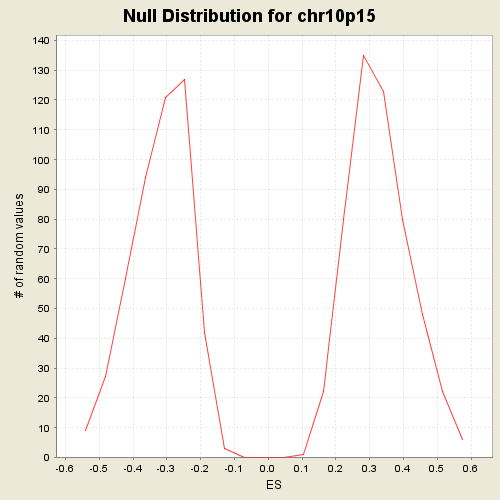
| GeneSet | C1.symbols.gmt#chr10p15 |
| Enrichment Score (ES) | 0.48575813 |
| Normalized Enrichment Score (NES) | 1.4771132 |
| Nominal p-value | 0.054158606 |
| FDR q-value | 0.5202858 |
| FWER p-Value | 0.829 |
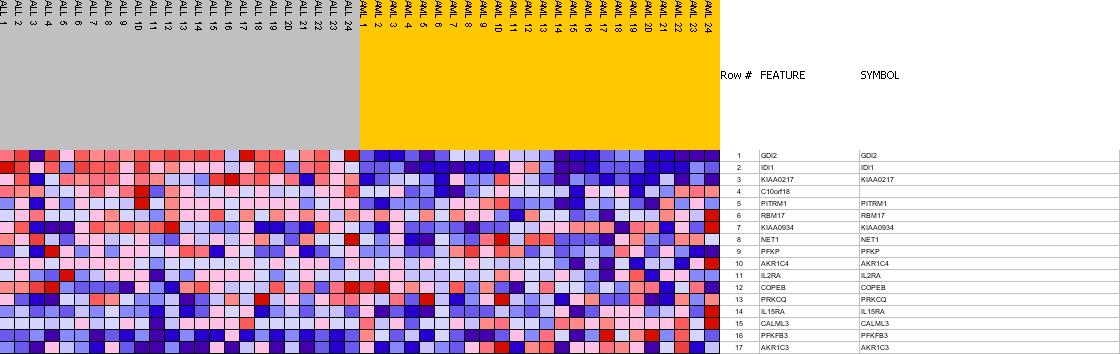
| PROBE | GENE SYMBOL | GENE_TITLE | RANK IN GENE LIST | RANK METRIC SCORE | RES | CORE_ENRICHMENT | |
|---|---|---|---|---|---|---|---|
| 1 | GDI2 | GDI2 StanfordSource, GeneCards | GDP dissociation inhibitor 2 | 31 | 1.439 | 0.2231 | Yes |
| 2 | IDI1 | IDI1 StanfordSource, GeneCards | isopentenyl-diphosphate delta isomerase | 87 | 1.214 | 0.4084 | Yes |
| 3 | KIAA0217 | KIAA0217 StanfordSource, GeneCards | KIAA0217 protein | 597 | 0.814 | 0.4858 | Yes |
| 4 | C10orf18 | 2379 | 0.412 | 0.3732 | No | ||
| 5 | PITRM1 | PITRM1 StanfordSource, GeneCards | pitrilysin metalloproteinase 1 | 3490 | 0.245 | 0.3011 | No |
| 6 | RBM17 | RBM17 StanfordSource, GeneCards | RNA binding motif protein 17 | 3818 | 0.202 | 0.3003 | No |
| 7 | KIAA0934 | KIAA0934 StanfordSource, GeneCards | KIAA0934 protein | 4171 | 0.159 | 0.2903 | No |
| 8 | NET1 | NET1 StanfordSource, GeneCards | neuroepithelial cell transforming gene 1 | 4551 | 0.110 | 0.2698 | No |
| 9 | PFKP | PFKP StanfordSource, GeneCards | phosphofructokinase, platelet | 4681 | 0.094 | 0.2716 | No |
| 10 | AKR1C4 | AKR1C4 StanfordSource, GeneCards | aldo-keto reductase family 1, member C4 (chlordecone reductase; 3-alpha hydroxysteroid dehydrogenase, type I; dihydrodiol dehydrogenase 4) | 4722 | 0.090 | 0.2817 | No |
| 11 | IL2RA | IL2RA StanfordSource, GeneCards | interleukin 2 receptor, alpha | 4927 | 0.064 | 0.2714 | No |
| 12 | COPEB | COPEB StanfordSource, GeneCards | core promoter element binding protein | 5264 | 0.025 | 0.2418 | No |
| 13 | PRKCQ | PRKCQ StanfordSource, GeneCards | protein kinase C, theta | 5398 | 0.007 | 0.2297 | No |
| 14 | IL15RA | IL15RA StanfordSource, GeneCards | interleukin 15 receptor, alpha | 7276 | -0.206 | 0.0751 | No |
| 15 | CALML3 | CALML3 StanfordSource, GeneCards | calmodulin-like 3 | 7570 | -0.241 | 0.0838 | No |
| 16 | PFKFB3 | PFKFB3 StanfordSource, GeneCards | 6-phosphofructo-2-kinase/fructose-2,6-biphosphatase 3 | 9126 | -0.513 | 0.0095 | No |
| 17 | AKR1C3 | AKR1C3 StanfordSource, GeneCards | aldo-keto reductase family 1, member C3 (3-alpha hydroxysteroid dehydrogenase, type II) | 9178 | -0.528 | 0.0874 | No |