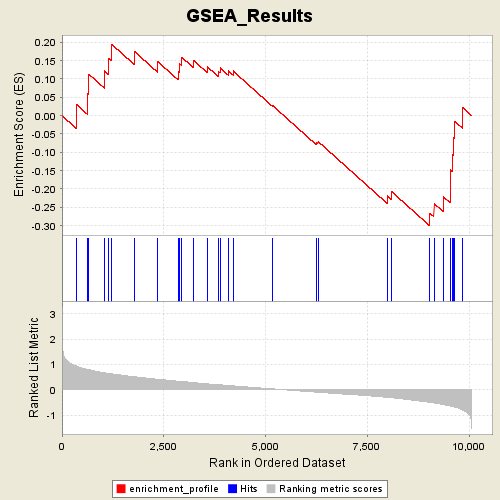
Profile of the Running ES Score & Positions of GeneSet Members on the Rank Ordered List
| Dataset | Leukemia_collapsed.gct |
| Phenotype | AML |
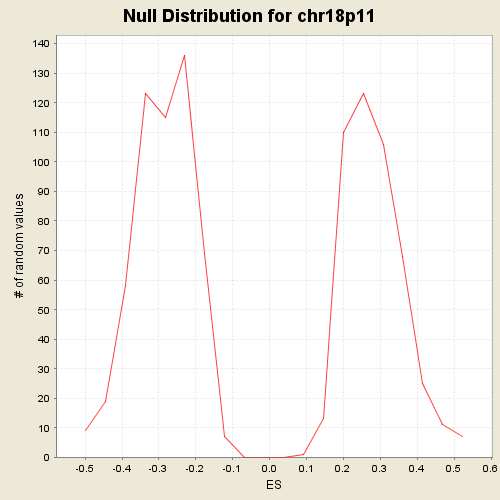
| GeneSet | C1.symbols.gmt#chr18p11 |
| Enrichment Score (ES) | -0.30086908 |
| Normalized Enrichment Score (NES) | -1.0479387 |
| Nominal p-value | 0.43097016 |
| FDR q-value | 1.0 |
| FWER p-Value | 0.996 |
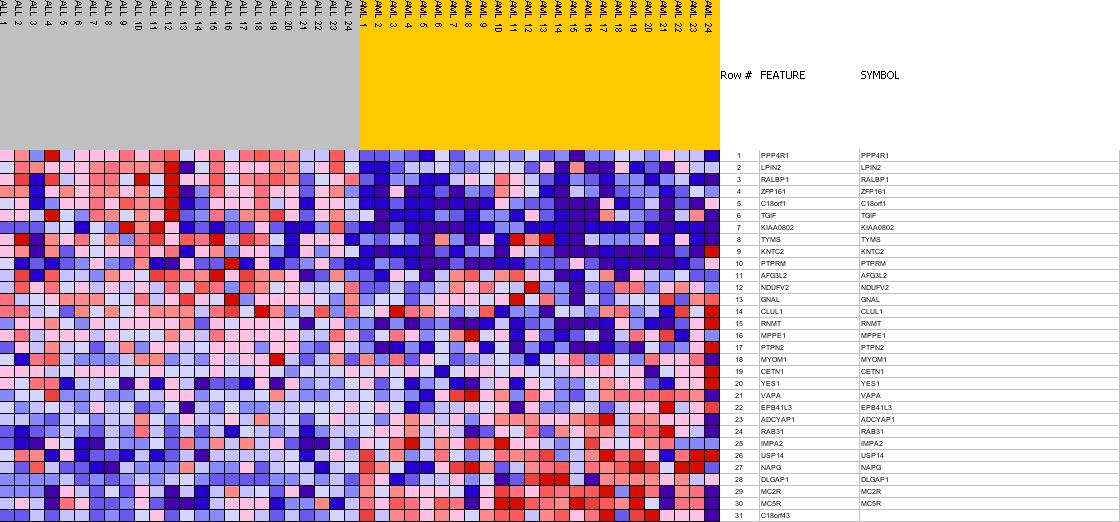
| PROBE | GENE SYMBOL | GENE_TITLE | RANK IN GENE LIST | RANK METRIC SCORE | RES | CORE_ENRICHMENT | |
|---|---|---|---|---|---|---|---|
| 1 | PPP4R1 | PPP4R1 StanfordSource, GeneCards | protein phosphatase 4, regulatory subunit 1 | 353 | 0.930 | 0.0306 | No |
| 2 | LPIN2 | LPIN2 StanfordSource, GeneCards | lipin 2 | 631 | 0.801 | 0.0595 | No |
| 3 | RALBP1 | RALBP1 StanfordSource, GeneCards | ralA binding protein 1 | 658 | 0.793 | 0.1130 | No |
| 4 | ZFP161 | ZFP161 StanfordSource, GeneCards | zinc finger protein 161 homolog (mouse) | 1041 | 0.667 | 0.1221 | No |
| 5 | C18orf1 | C18orf1 StanfordSource, GeneCards | chromosome 18 open reading frame 1 | 1149 | 0.642 | 0.1568 | No |
| 6 | TGIF | TGIF StanfordSource, GeneCards | TGFB-induced factor (TALE family homeobox) | 1219 | 0.630 | 0.1944 | No |
| 7 | KIAA0802 | KIAA0802 StanfordSource, GeneCards | KIAA0802 protein | 1785 | 0.511 | 0.1742 | No |
| 8 | TYMS | TYMS StanfordSource, GeneCards | thymidylate synthetase | 2357 | 0.415 | 0.1466 | No |
| 9 | KNTC2 | KNTC2 StanfordSource, GeneCards | kinetochore associated 2 | 2851 | 0.338 | 0.1213 | No |
| 10 | PTPRM | PTPRM StanfordSource, GeneCards | protein tyrosine phosphatase, receptor type, M | 2877 | 0.333 | 0.1424 | No |
| 11 | AFG3L2 | AFG3L2 StanfordSource, GeneCards | AFG3 ATPase family gene 3-like 2 (yeast) | 2937 | 0.325 | 0.1595 | No |
| 12 | NDUFV2 | NDUFV2 StanfordSource, GeneCards | NADH dehydrogenase (ubiquinone) flavoprotein 2, 24kDa | 3226 | 0.285 | 0.1509 | No |
| 13 | GNAL | GNAL StanfordSource, GeneCards | guanine nucleotide binding protein (G protein), alpha activating activity polypeptide, olfactory type | 3572 | 0.232 | 0.1329 | No |
| 14 | CLUL1 | CLUL1 StanfordSource, GeneCards | clusterin-like 1 (retinal) | 3848 | 0.200 | 0.1195 | No |
| 15 | RNMT | RNMT StanfordSource, GeneCards | RNA (guanine-7-) methyltransferase | 3882 | 0.196 | 0.1301 | No |
| 16 | MPPE1 | MPPE1 StanfordSource, GeneCards | metallophosphoesterase 1 | 4084 | 0.170 | 0.1221 | No |
| 17 | PTPN2 | PTPN2 StanfordSource, GeneCards | protein tyrosine phosphatase, non-receptor type 2 | 4200 | 0.156 | 0.1216 | No |
| 18 | MYOM1 | MYOM1 StanfordSource, GeneCards | myomesin 1 (skelemin) 185kDa | 5178 | 0.035 | 0.0266 | No |
| 19 | CETN1 | CETN1 StanfordSource, GeneCards | centrin, EF-hand protein, 1 | 6239 | -0.092 | -0.0726 | No |
| 20 | YES1 | YES1 StanfordSource, GeneCards | v-yes-1 Yamaguchi sarcoma viral oncogene homolog 1 | 6286 | -0.097 | -0.0704 | No |
| 21 | VAPA | VAPA StanfordSource, GeneCards | VAMP (vesicle-associated membrane protein)-associated protein A, 33kDa | 7989 | -0.297 | -0.2191 | No |
| 22 | EPB41L3 | EPB41L3 StanfordSource, GeneCards | erythrocyte membrane protein band 4.1-like 3 | 8095 | -0.312 | -0.2075 | No |
| 23 | ADCYAP1 | ADCYAP1 StanfordSource, GeneCards | adenylate cyclase activating polypeptide 1 (pituitary) | 9032 | -0.494 | -0.2659 | Yes |
| 24 | RAB31 | RAB31 StanfordSource, GeneCards | RAB31, member RAS oncogene family | 9134 | -0.516 | -0.2395 | Yes |
| 25 | IMPA2 | IMPA2 StanfordSource, GeneCards | inositol(myo)-1(or 4)-monophosphatase 2 | 9367 | -0.580 | -0.2216 | Yes |
| 26 | USP14 | USP14 StanfordSource, GeneCards | ubiquitin specific protease 14 (tRNA-guanine transglycosylase) | 9528 | -0.638 | -0.1924 | Yes |
| 27 | NAPG | NAPG StanfordSource, GeneCards | N-ethylmaleimide-sensitive factor attachment protein, gamma | 9546 | -0.649 | -0.1483 | Yes |
| 28 | DLGAP1 | DLGAP1 StanfordSource, GeneCards | discs, large (Drosophila) homolog-associated protein 1 | 9581 | -0.659 | -0.1050 | Yes |
| 29 | MC2R | MC2R StanfordSource, GeneCards | melanocortin 2 receptor (adrenocorticotropic hormone) | 9611 | -0.670 | -0.0605 | Yes |
| 30 | MC5R | MC5R StanfordSource, GeneCards | melanocortin 5 receptor | 9637 | -0.681 | -0.0149 | Yes |
| 31 | C18orf43 | 9844 | -0.799 | 0.0210 | Yes |