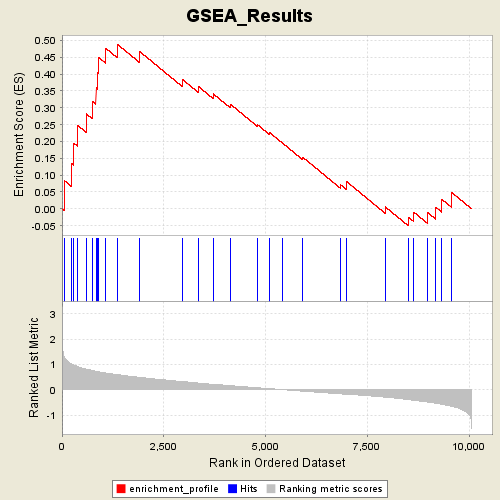
Profile of the Running ES Score & Positions of GeneSet Members on the Rank Ordered List
| Dataset | Leukemia_collapsed.gct |
| Phenotype | ALL |
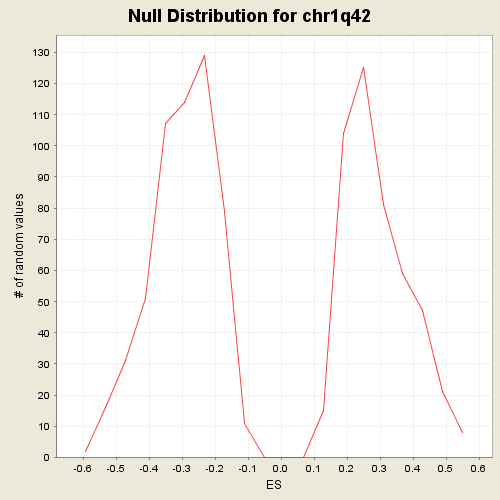
| GeneSet | C1.symbols.gmt#chr1q42 |
| Enrichment Score (ES) | 0.4882626 |
| Normalized Enrichment Score (NES) | 1.6743091 |
| Nominal p-value | 0.032608695 |
| FDR q-value | 0.19049485 |
| FWER p-Value | 0.481 |
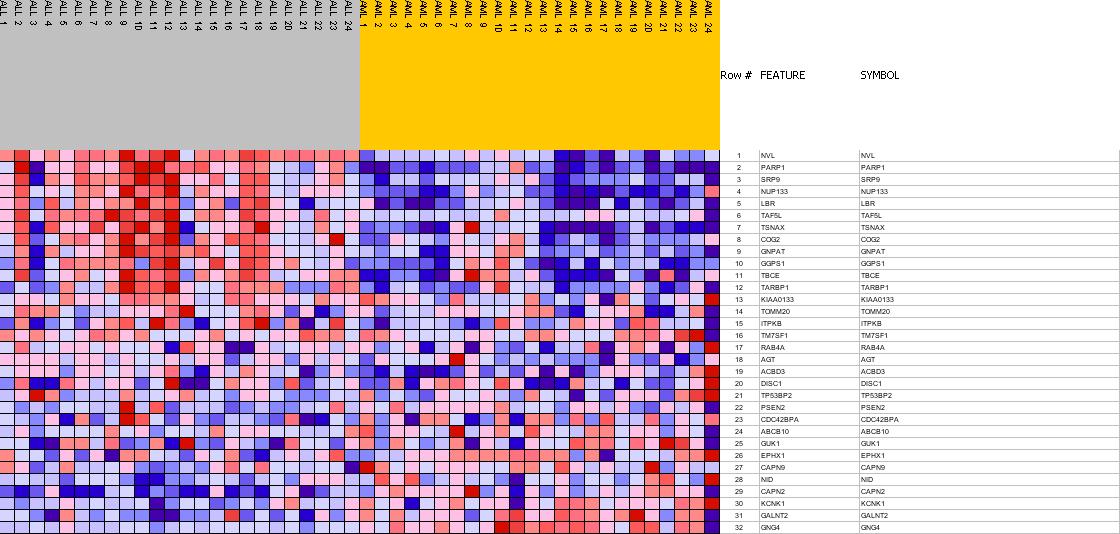
| PROBE | GENE SYMBOL | GENE_TITLE | RANK IN GENE LIST | RANK METRIC SCORE | RES | CORE_ENRICHMENT | |
|---|---|---|---|---|---|---|---|
| 1 | NVL | NVL StanfordSource, GeneCards | nuclear VCP-like | 51 | 1.325 | 0.0845 | Yes |
| 2 | PARP1 | PARP1 StanfordSource, GeneCards | poly (ADP-ribose) polymerase family, member 1 | 233 | 1.022 | 0.1356 | Yes |
| 3 | SRP9 | SRP9 StanfordSource, GeneCards | signal recognition particle 9kDa | 291 | 0.964 | 0.1951 | Yes |
| 4 | NUP133 | NUP133 StanfordSource, GeneCards | nucleoporin 133kDa | 387 | 0.914 | 0.2474 | Yes |
| 5 | LBR | LBR StanfordSource, GeneCards | lamin B receptor | 593 | 0.815 | 0.2821 | Yes |
| 6 | TAF5L | TAF5L StanfordSource, GeneCards | TAF5-like RNA polymerase II, p300/CBP-associated factor (PCAF)-associated factor, 65kDa | 738 | 0.766 | 0.3195 | Yes |
| 7 | TSNAX | TSNAX StanfordSource, GeneCards | translin-associated factor X | 835 | 0.730 | 0.3593 | Yes |
| 8 | COG2 | COG2 StanfordSource, GeneCards | component of oligomeric golgi complex 2 | 876 | 0.714 | 0.4036 | Yes |
| 9 | GNPAT | GNPAT StanfordSource, GeneCards | glyceronephosphate O-acyltransferase | 892 | 0.709 | 0.4501 | Yes |
| 10 | GGPS1 | GGPS1 StanfordSource, GeneCards | geranylgeranyl diphosphate synthase 1 | 1078 | 0.657 | 0.4761 | Yes |
| 11 | TBCE | TBCE StanfordSource, GeneCards | tubulin-specific chaperone e | 1361 | 0.597 | 0.4883 | Yes |
| 12 | TARBP1 | TARBP1 StanfordSource, GeneCards | TAR (HIV) RNA binding protein 1 | 1903 | 0.489 | 0.4674 | No |
| 13 | KIAA0133 | KIAA0133 StanfordSource, GeneCards | KIAA0133 gene product | 2960 | 0.321 | 0.3837 | No |
| 14 | TOMM20 | TOMM20 StanfordSource, GeneCards | translocase of outer mitochondrial membrane 20 homolog (yeast) | 3346 | 0.267 | 0.3634 | No |
| 15 | ITPKB | ITPKB StanfordSource, GeneCards | inositol 1,4,5-trisphosphate 3-kinase B | 3716 | 0.214 | 0.3410 | No |
| 16 | TM7SF1 | TM7SF1 StanfordSource, GeneCards | transmembrane 7 superfamily member 1 (upregulated in kidney) | 4130 | 0.166 | 0.3110 | No |
| 17 | RAB4A | RAB4A StanfordSource, GeneCards | RAB4A, member RAS oncogene family | 4808 | 0.079 | 0.2489 | No |
| 18 | AGT | AGT StanfordSource, GeneCards | angiotensinogen (serine (or cysteine) proteinase inhibitor, clade A (alpha-1 antiproteinase, antitrypsin), member 8) | 5086 | 0.046 | 0.2244 | No |
| 19 | ACBD3 | ACBD3 StanfordSource, GeneCards | acyl-Coenzyme A binding domain containing 3 | 5107 | 0.044 | 0.2253 | No |
| 20 | DISC1 | DISC1 StanfordSource, GeneCards | disrupted in schizophrenia 1 | 5424 | 0.004 | 0.1941 | No |
| 21 | TP53BP2 | TP53BP2 StanfordSource, GeneCards | tumor protein p53 binding protein, 2 | 5902 | -0.055 | 0.1502 | No |
| 22 | PSEN2 | PSEN2 StanfordSource, GeneCards | presenilin 2 (Alzheimer disease 4) | 5912 | -0.056 | 0.1531 | No |
| 23 | CDC42BPA | CDC42BPA StanfordSource, GeneCards | CDC42 binding protein kinase alpha (DMPK-like) | 6840 | -0.161 | 0.0715 | No |
| 24 | ABCB10 | ABCB10 StanfordSource, GeneCards | ATP-binding cassette, sub-family B (MDR/TAP), member 10 | 6982 | -0.177 | 0.0694 | No |
| 25 | GUK1 | GUK1 StanfordSource, GeneCards | guanylate kinase 1 | 6988 | -0.178 | 0.0810 | No |
| 26 | EPHX1 | EPHX1 StanfordSource, GeneCards | epoxide hydrolase 1, microsomal (xenobiotic) | 7932 | -0.290 | 0.0065 | No |
| 27 | CAPN9 | CAPN9 StanfordSource, GeneCards | calpain 9 (nCL-4) | 8507 | -0.386 | -0.0247 | No |
| 28 | NID | NID StanfordSource, GeneCards | nidogen (enactin) | 8635 | -0.412 | -0.0095 | No |
| 29 | CAPN2 | CAPN2 StanfordSource, GeneCards | calpain 2, (m/II) large subunit | 8974 | -0.482 | -0.0106 | No |
| 30 | KCNK1 | KCNK1 StanfordSource, GeneCards | potassium channel, subfamily K, member 1 | 9173 | -0.527 | 0.0053 | No |
| 31 | GALNT2 | GALNT2 StanfordSource, GeneCards | UDP-N-acetyl-alpha-D-galactosamine:polypeptide N-acetylgalactosaminyltransferase 2 (GalNAc-T2) | 9323 | -0.565 | 0.0286 | No |
| 32 | GNG4 | GNG4 StanfordSource, GeneCards | guanine nucleotide binding protein (G protein), gamma 4 | 9560 | -0.655 | 0.0494 | No |