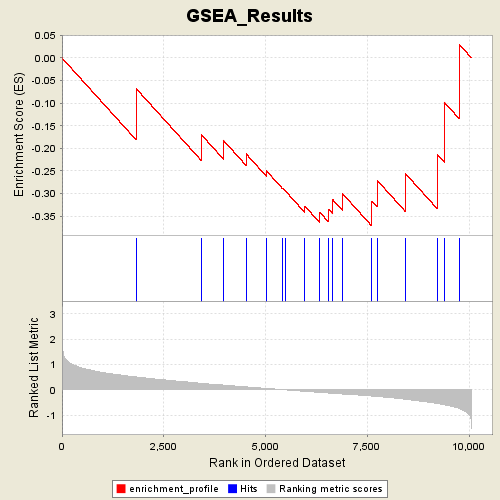
Profile of the Running ES Score & Positions of GeneSet Members on the Rank Ordered List
| Dataset | Leukemia_collapsed.gct |
| Phenotype | AML |
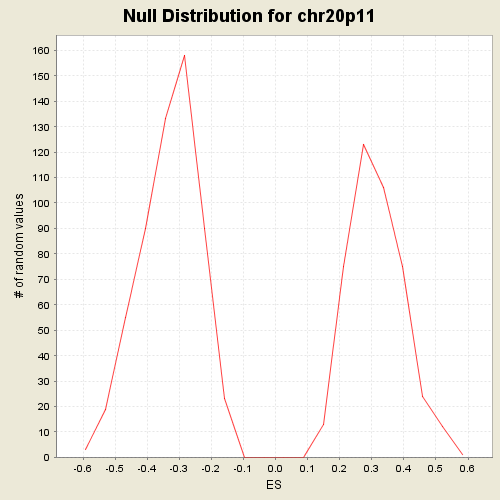
| GeneSet | C1.symbols.gmt#chr20p11 |
| Enrichment Score (ES) | -0.372002 |
| Normalized Enrichment Score (NES) | -1.1248972 |
| Nominal p-value | 0.30998248 |
| FDR q-value | 1.0 |
| FWER p-Value | 0.993 |
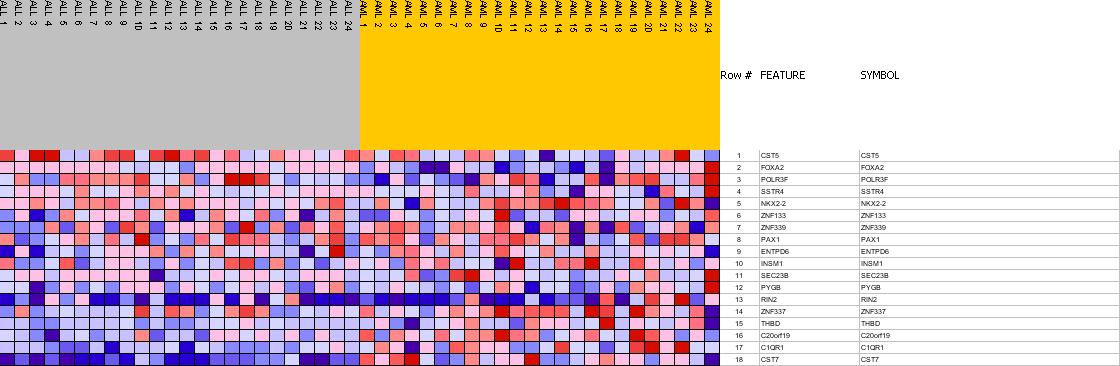
| PROBE | GENE SYMBOL | GENE_TITLE | RANK IN GENE LIST | RANK METRIC SCORE | RES | CORE_ENRICHMENT | |
|---|---|---|---|---|---|---|---|
| 1 | CST5 | CST5 StanfordSource, GeneCards | cystatin D | 1819 | 0.505 | -0.0677 | No |
| 2 | FOXA2 | FOXA2 StanfordSource, GeneCards | forkhead box A2 | 3425 | 0.254 | -0.1704 | No |
| 3 | POLR3F | POLR3F StanfordSource, GeneCards | polymerase (RNA) III (DNA directed) polypeptide F, 39 kDa | 3968 | 0.184 | -0.1830 | No |
| 4 | SSTR4 | SSTR4 StanfordSource, GeneCards | somatostatin receptor 4 | 4519 | 0.114 | -0.2123 | No |
| 5 | NKX2-2 | NKX2-2 StanfordSource, GeneCards | NK2 transcription factor related, locus 2 (Drosophila) | 5016 | 0.054 | -0.2497 | No |
| 6 | ZNF133 | ZNF133 StanfordSource, GeneCards | zinc finger protein 133 (clone pHZ-13) | 5419 | 0.005 | -0.2886 | No |
| 7 | ZNF339 | ZNF339 StanfordSource, GeneCards | zinc finger protein 339 | 5478 | -0.002 | -0.2939 | No |
| 8 | PAX1 | PAX1 StanfordSource, GeneCards | paired box gene 1 | 5961 | -0.062 | -0.3280 | No |
| 9 | ENTPD6 | ENTPD6 StanfordSource, GeneCards | ectonucleoside triphosphate diphosphohydrolase 6 (putative function) | 6330 | -0.101 | -0.3419 | No |
| 10 | INSM1 | INSM1 StanfordSource, GeneCards | insulinoma-associated 1 | 6544 | -0.126 | -0.3348 | No |
| 11 | SEC23B | SEC23B StanfordSource, GeneCards | Sec23 homolog B (S. cerevisiae) | 6647 | -0.138 | -0.3139 | No |
| 12 | PYGB | PYGB StanfordSource, GeneCards | phosphorylase, glycogen; brain | 6879 | -0.166 | -0.2997 | No |
| 13 | RIN2 | RIN2 StanfordSource, GeneCards | Ras and Rab interactor 2 | 7606 | -0.245 | -0.3170 | Yes |
| 14 | ZNF337 | ZNF337 StanfordSource, GeneCards | zinc finger protein 337 | 7736 | -0.262 | -0.2708 | Yes |
| 15 | THBD | THBD StanfordSource, GeneCards | thrombomodulin | 8440 | -0.374 | -0.2569 | Yes |
| 16 | C20orf19 | C20orf19 StanfordSource, GeneCards | chromosome 20 open reading frame 19 | 9210 | -0.535 | -0.2131 | Yes |
| 17 | C1QR1 | C1QR1 StanfordSource, GeneCards | complement component 1, q subcomponent, receptor 1 | 9398 | -0.589 | -0.0992 | Yes |
| 18 | CST7 | CST7 StanfordSource, GeneCards | cystatin F (leukocystatin) | 9752 | -0.732 | 0.0302 | Yes |