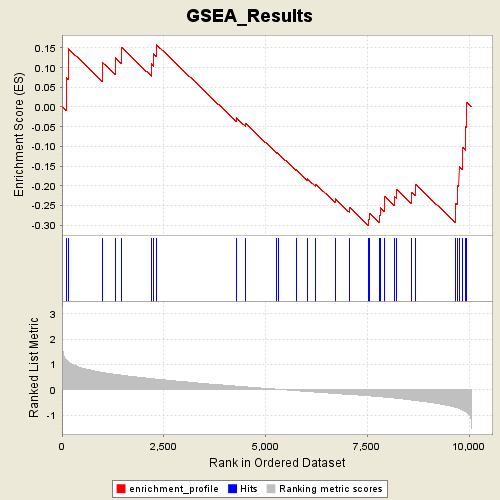
Profile of the Running ES Score & Positions of GeneSet Members on the Rank Ordered List
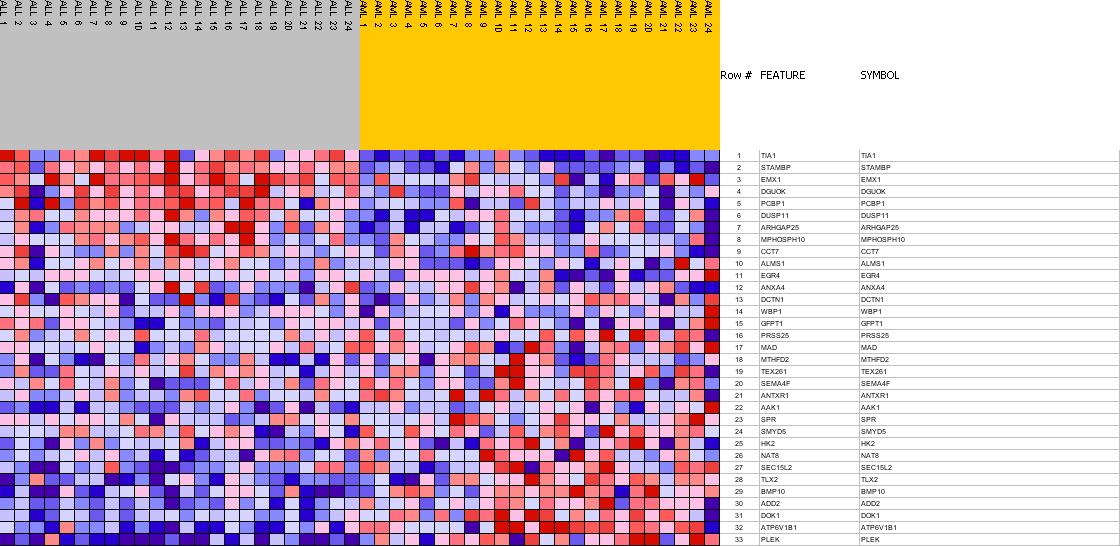
| Dataset | Leukemia_collapsed.gct |
| Phenotype | AML |
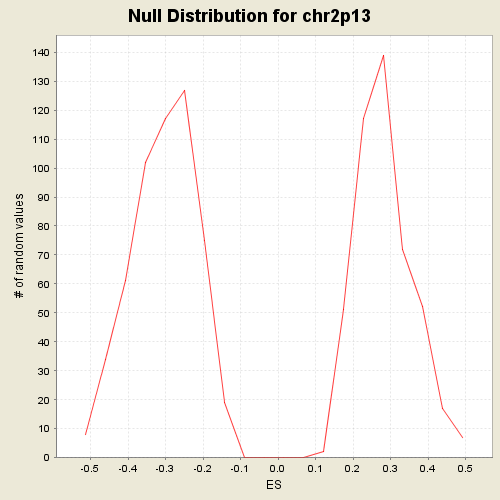
| GeneSet | C1.symbols.gmt#chr2p13 |
| Enrichment Score (ES) | -0.30221254 |
| Normalized Enrichment Score (NES) | -0.9976464 |
| Nominal p-value | 0.4567219 |
| FDR q-value | 1.0 |
| FWER p-Value | 0.998 |
| PROBE | GENE SYMBOL | GENE_TITLE | RANK IN GENE LIST | RANK METRIC SCORE | RES | CORE_ENRICHMENT | |
|---|---|---|---|---|---|---|---|
| 1 | TIA1 | TIA1 StanfordSource, GeneCards | TIA1 cytotoxic granule-associated RNA binding protein | 100 | 1.195 | 0.0753 | No |
| 2 | STAMBP | STAMBP StanfordSource, GeneCards | STAM binding protein | 161 | 1.096 | 0.1476 | No |
| 3 | EMX1 | EMX1 StanfordSource, GeneCards | empty spiracles homolog 1 (Drosophila) | 1001 | 0.675 | 0.1121 | No |
| 4 | DGUOK | DGUOK StanfordSource, GeneCards | deoxyguanosine kinase | 1303 | 0.611 | 0.1257 | No |
| 5 | PCBP1 | PCBP1 StanfordSource, GeneCards | poly(rC) binding protein 1 | 1458 | 0.576 | 0.1515 | No |
| 6 | DUSP11 | DUSP11 StanfordSource, GeneCards | dual specificity phosphatase 11 (RNA/RNP complex 1-interacting) | 2198 | 0.440 | 0.1091 | No |
| 7 | ARHGAP25 | ARHGAP25 StanfordSource, GeneCards | Rho GTPase activating protein 25 | 2254 | 0.431 | 0.1344 | No |
| 8 | MPHOSPH10 | MPHOSPH10 StanfordSource, GeneCards | M-phase phosphoprotein 10 (U3 small nucleolar ribonucleoprotein) | 2310 | 0.422 | 0.1591 | No |
| 9 | CCT7 | CCT7 StanfordSource, GeneCards | chaperonin containing TCP1, subunit 7 (eta) | 4288 | 0.144 | -0.0279 | No |
| 10 | ALMS1 | ALMS1 StanfordSource, GeneCards | Alstrom syndrome 1 | 4515 | 0.114 | -0.0423 | No |
| 11 | EGR4 | EGR4 StanfordSource, GeneCards | early growth response 4 | 5266 | 0.024 | -0.1154 | No |
| 12 | ANXA4 | ANXA4 StanfordSource, GeneCards | annexin A4 | 5312 | 0.019 | -0.1185 | No |
| 13 | DCTN1 | DCTN1 StanfordSource, GeneCards | dynactin 1 (p150, glued homolog, Drosophila) | 5754 | -0.036 | -0.1600 | No |
| 14 | WBP1 | WBP1 StanfordSource, GeneCards | WW domain binding protein 1 | 6029 | -0.069 | -0.1824 | No |
| 15 | GFPT1 | GFPT1 StanfordSource, GeneCards | glutamine-fructose-6-phosphate transaminase 1 | 6233 | -0.092 | -0.1961 | No |
| 16 | PRSS25 | PRSS25 StanfordSource, GeneCards | protease, serine, 25 | 6712 | -0.146 | -0.2334 | No |
| 17 | MAD | MAD StanfordSource, GeneCards | MAX dimerization protein 1 | 7064 | -0.186 | -0.2551 | No |
| 18 | MTHFD2 | MTHFD2 StanfordSource, GeneCards | methylene tetrahydrofolate dehydrogenase (NAD+ dependent), methenyltetrahydrofolate cyclohydrolase | 7537 | -0.236 | -0.2854 | Yes |
| 19 | TEX261 | TEX261 StanfordSource, GeneCards | testis expressed gene 261 | 7548 | -0.238 | -0.2694 | Yes |
| 20 | SEMA4F | SEMA4F StanfordSource, GeneCards | sema domain, immunoglobulin domain (Ig), transmembrane domain (TM) and short cytoplasmic domain, (semaphorin) 4F | 7797 | -0.270 | -0.2748 | Yes |
| 21 | ANTXR1 | ANTXR1 StanfordSource, GeneCards | anthrax toxin receptor 1 | 7810 | -0.272 | -0.2566 | Yes |
| 22 | AAK1 | AAK1 StanfordSource, GeneCards | AP2 associated kinase 1 | 7909 | -0.286 | -0.2460 | Yes |
| 23 | SPR | SPR StanfordSource, GeneCards | sepiapterin reductase (7,8-dihydrobiopterin:NADP+ oxidoreductase) | 7930 | -0.290 | -0.2273 | Yes |
| 24 | SMYD5 | SMYD5 StanfordSource, GeneCards | SMYD family member 5 | 8156 | -0.322 | -0.2267 | Yes |
| 25 | HK2 | HK2 StanfordSource, GeneCards | hexokinase 2 | 8211 | -0.330 | -0.2085 | Yes |
| 26 | NAT8 | NAT8 StanfordSource, GeneCards | N-acetyltransferase 8 (camello like) | 8575 | -0.399 | -0.2163 | Yes |
| 27 | SEC15L2 | SEC15L2 StanfordSource, GeneCards | SEC15-like 2 (S. cerevisiae) | 8675 | -0.423 | -0.1960 | Yes |
| 28 | TLX2 | TLX2 StanfordSource, GeneCards | T-cell leukemia, homeobox 2 | 9655 | -0.690 | -0.2444 | Yes |
| 29 | BMP10 | BMP10 StanfordSource, GeneCards | bone morphogenetic protein 10 | 9701 | -0.708 | -0.1984 | Yes |
| 30 | ADD2 | ADD2 StanfordSource, GeneCards | adducin 2 (beta) | 9748 | -0.730 | -0.1508 | Yes |
| 31 | DOK1 | DOK1 StanfordSource, GeneCards | docking protein 1, 62kDa (downstream of tyrosine kinase 1) | 9829 | -0.792 | -0.1023 | Yes |
| 32 | ATP6V1B1 | ATP6V1B1 StanfordSource, GeneCards | ATPase, H+ transporting, lysosomal 56/58kDa, V1 subunit B, isoform 1 (Renal tubular acidosis with deafness) | 9918 | -0.858 | -0.0497 | Yes |
| 33 | PLEK | PLEK StanfordSource, GeneCards | pleckstrin | 9942 | -0.887 | 0.0113 | Yes |