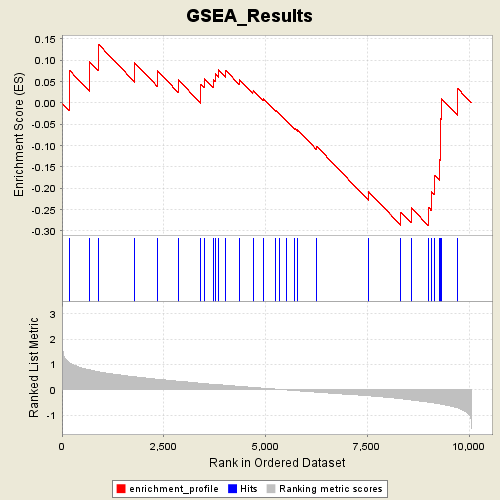
Profile of the Running ES Score & Positions of GeneSet Members on the Rank Ordered List
| Dataset | Leukemia_collapsed.gct |
| Phenotype | AML |
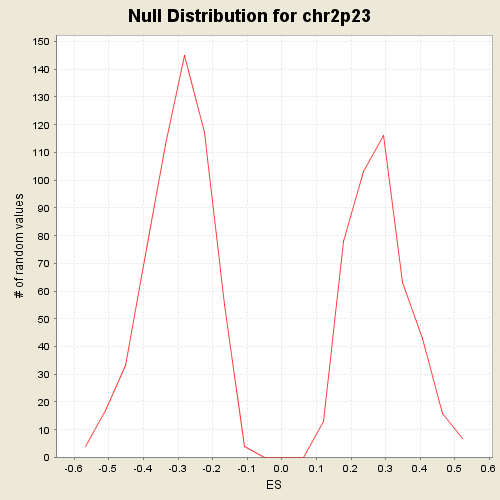
| GeneSet | C1.symbols.gmt#chr2p23 |
| Enrichment Score (ES) | -0.28816748 |
| Normalized Enrichment Score (NES) | -0.9523794 |
| Nominal p-value | 0.51693404 |
| FDR q-value | 1.0 |
| FWER p-Value | 0.999 |
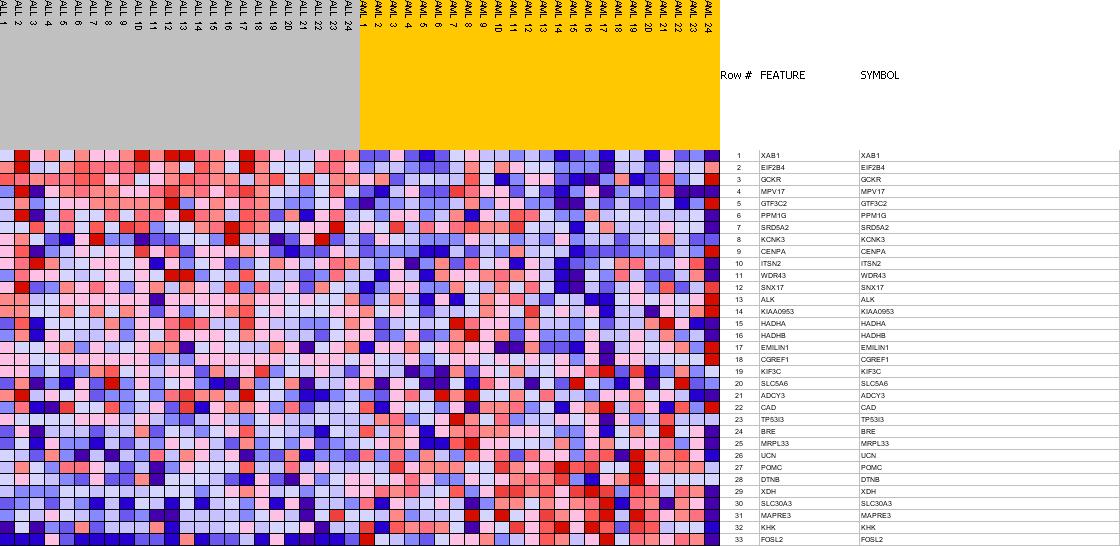
| PROBE | GENE SYMBOL | GENE_TITLE | RANK IN GENE LIST | RANK METRIC SCORE | RES | CORE_ENRICHMENT | |
|---|---|---|---|---|---|---|---|
| 1 | XAB1 | XAB1 StanfordSource, GeneCards | XPA binding protein 1 | 181 | 1.073 | 0.0768 | No |
| 2 | EIF2B4 | EIF2B4 StanfordSource, GeneCards | eukaryotic translation initiation factor 2B, subunit 4 delta, 67kDa | 678 | 0.786 | 0.0968 | No |
| 3 | GCKR | GCKR StanfordSource, GeneCards | glucokinase (hexokinase 4) regulatory protein | 897 | 0.707 | 0.1375 | No |
| 4 | MPV17 | MPV17 StanfordSource, GeneCards | MpV17 transgene, murine homolog, glomerulosclerosis | 1787 | 0.511 | 0.0940 | No |
| 5 | GTF3C2 | GTF3C2 StanfordSource, GeneCards | general transcription factor IIIC, polypeptide 2, beta 110kDa | 2340 | 0.418 | 0.0758 | No |
| 6 | PPM1G | PPM1G StanfordSource, GeneCards | protein phosphatase 1G (formerly 2C), magnesium-dependent, gamma isoform | 2857 | 0.337 | 0.0541 | No |
| 7 | SRD5A2 | SRD5A2 StanfordSource, GeneCards | steroid-5-alpha-reductase, alpha polypeptide 2 (3-oxo-5 alpha-steroid delta 4-dehydrogenase alpha 2) | 3406 | 0.256 | 0.0221 | No |
| 8 | KCNK3 | KCNK3 StanfordSource, GeneCards | potassium channel, subfamily K, member 3 | 3410 | 0.256 | 0.0444 | No |
| 9 | CENPA | CENPA StanfordSource, GeneCards | centromere protein A, 17kDa | 3491 | 0.244 | 0.0580 | No |
| 10 | ITSN2 | ITSN2 StanfordSource, GeneCards | intersectin 2 | 3719 | 0.214 | 0.0543 | No |
| 11 | WDR43 | WDR43 StanfordSource, GeneCards | WD repeat domain 43 | 3758 | 0.209 | 0.0689 | No |
| 12 | SNX17 | SNX17 StanfordSource, GeneCards | sorting nexin 17 | 3847 | 0.200 | 0.0778 | No |
| 13 | ALK | ALK StanfordSource, GeneCards | anaplastic lymphoma kinase (Ki-1) | 4025 | 0.177 | 0.0758 | No |
| 14 | KIAA0953 | KIAA0953 StanfordSource, GeneCards | KIAA0953 protein | 4361 | 0.134 | 0.0542 | No |
| 15 | HADHA | HADHA StanfordSource, GeneCards | hydroxyacyl-Coenzyme A dehydrogenase/3-ketoacyl-Coenzyme A thiolase/enoyl-Coenzyme A hydratase (trifunctional protein), alpha subunit | 4690 | 0.093 | 0.0297 | No |
| 16 | HADHB | HADHB StanfordSource, GeneCards | hydroxyacyl-Coenzyme A dehydrogenase/3-ketoacyl-Coenzyme A thiolase/enoyl-Coenzyme A hydratase (trifunctional protein), beta subunit | 4940 | 0.062 | 0.0104 | No |
| 17 | EMILIN1 | EMILIN1 StanfordSource, GeneCards | elastin microfibril interfacer 1 | 5243 | 0.027 | -0.0174 | No |
| 18 | CGREF1 | CGREF1 StanfordSource, GeneCards | cell growth regulator with EF hand domain 1 | 5328 | 0.016 | -0.0244 | No |
| 19 | KIF3C | KIF3C StanfordSource, GeneCards | kinesin family member 3C | 5504 | -0.005 | -0.0414 | No |
| 20 | SLC5A6 | SLC5A6 StanfordSource, GeneCards | solute carrier family 5 (sodium-dependent vitamin transporter), member 6 | 5716 | -0.031 | -0.0597 | No |
| 21 | ADCY3 | ADCY3 StanfordSource, GeneCards | adenylate cyclase 3 | 5780 | -0.039 | -0.0625 | No |
| 22 | CAD | CAD StanfordSource, GeneCards | carbamoyl-phosphate synthetase 2, aspartate transcarbamylase, and dihydroorotase | 6250 | -0.093 | -0.1011 | No |
| 23 | TP53I3 | TP53I3 StanfordSource, GeneCards | tumor protein p53 inducible protein 3 | 7530 | -0.235 | -0.2079 | No |
| 24 | BRE | BRE StanfordSource, GeneCards | brain and reproductive organ-expressed (TNFRSF1A modulator) | 8323 | -0.351 | -0.2559 | No |
| 25 | MRPL33 | MRPL33 StanfordSource, GeneCards | mitochondrial ribosomal protein L33 | 8574 | -0.399 | -0.2456 | No |
| 26 | UCN | UCN StanfordSource, GeneCards | urocortin | 9002 | -0.488 | -0.2450 | Yes |
| 27 | POMC | POMC StanfordSource, GeneCards | proopiomelanocortin (adrenocorticotropin/ beta-lipotropin/ alpha-melanocyte stimulating hormone/ beta-melanocyte stimulating hormone/ beta-endorphin) | 9067 | -0.500 | -0.2072 | Yes |
| 28 | DTNB | DTNB StanfordSource, GeneCards | dystrobrevin, beta | 9146 | -0.519 | -0.1692 | Yes |
| 29 | XDH | XDH StanfordSource, GeneCards | xanthine dehydrogenase | 9267 | -0.549 | -0.1326 | Yes |
| 30 | SLC30A3 | SLC30A3 StanfordSource, GeneCards | solute carrier family 30 (zinc transporter), member 3 | 9282 | -0.553 | -0.0851 | Yes |
| 31 | MAPRE3 | MAPRE3 StanfordSource, GeneCards | microtubule-associated protein, RP/EB family, member 3 | 9286 | -0.554 | -0.0364 | Yes |
| 32 | KHK | KHK StanfordSource, GeneCards | ketohexokinase (fructokinase) | 9307 | -0.561 | 0.0113 | Yes |
| 33 | FOSL2 | FOSL2 StanfordSource, GeneCards | FOS-like antigen 2 | 9720 | -0.716 | 0.0334 | Yes |