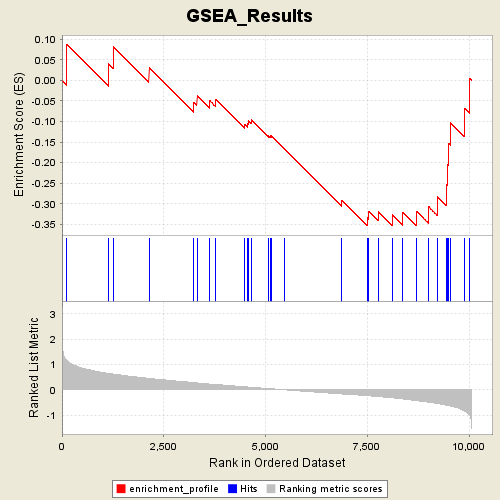
Profile of the Running ES Score & Positions of GeneSet Members on the Rank Ordered List
| Dataset | Leukemia_collapsed.gct |
| Phenotype | AML |
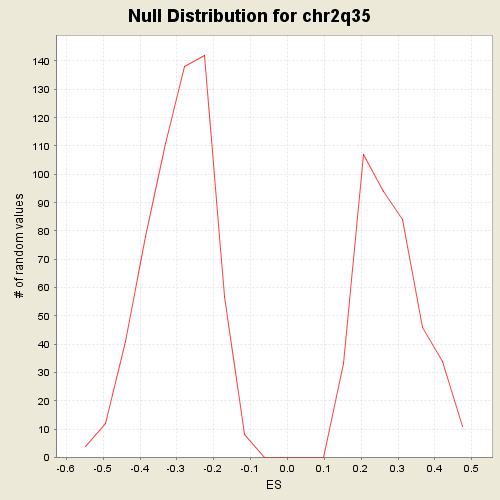
| GeneSet | C1.symbols.gmt#chr2q35 |
| Enrichment Score (ES) | -0.3544971 |
| Normalized Enrichment Score (NES) | -1.1990719 |
| Nominal p-value | 0.24703892 |
| FDR q-value | 1.0 |
| FWER p-Value | 0.983 |
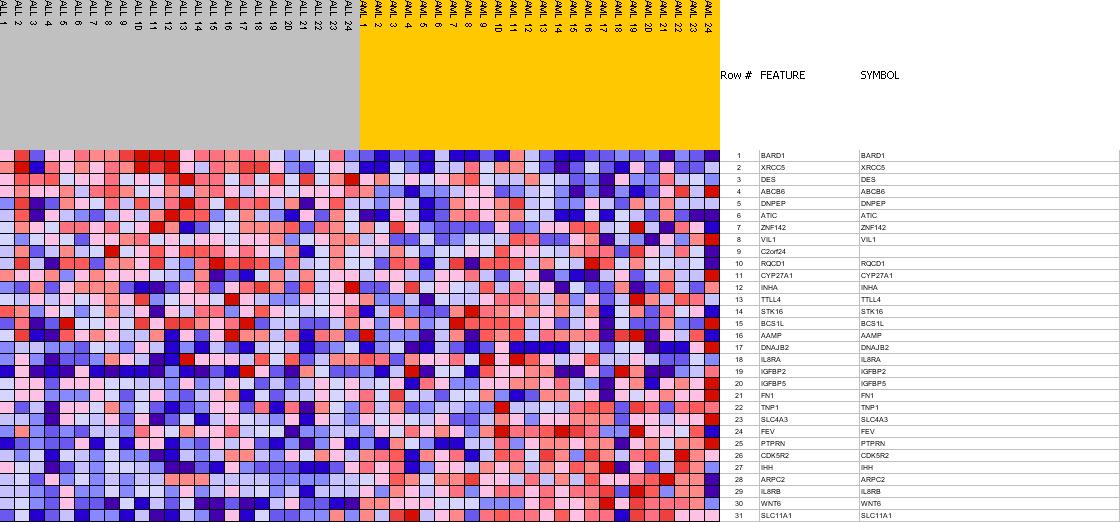
| PROBE | GENE SYMBOL | GENE_TITLE | RANK IN GENE LIST | RANK METRIC SCORE | RES | CORE_ENRICHMENT | |
|---|---|---|---|---|---|---|---|
| 1 | BARD1 | BARD1 StanfordSource, GeneCards | BRCA1 associated RING domain 1 | 114 | 1.168 | 0.0881 | No |
| 2 | XRCC5 | XRCC5 StanfordSource, GeneCards | X-ray repair complementing defective repair in Chinese hamster cells 5 (double-strand-break rejoining; Ku autoantigen, 80kDa) | 1139 | 0.644 | 0.0408 | No |
| 3 | DES | DES StanfordSource, GeneCards | desmin | 1259 | 0.620 | 0.0817 | No |
| 4 | ABCB6 | ABCB6 StanfordSource, GeneCards | ATP-binding cassette, sub-family B (MDR/TAP), member 6 | 2137 | 0.449 | 0.0324 | No |
| 5 | DNPEP | DNPEP StanfordSource, GeneCards | aspartyl aminopeptidase | 3237 | 0.284 | -0.0530 | No |
| 6 | ATIC | ATIC StanfordSource, GeneCards | 5-aminoimidazole-4-carboxamide ribonucleotide formyltransferase/IMP cyclohydrolase | 3315 | 0.271 | -0.0376 | No |
| 7 | ZNF142 | ZNF142 StanfordSource, GeneCards | zinc finger protein 142 (clone pHZ-49) | 3628 | 0.226 | -0.0495 | No |
| 8 | VIL1 | VIL1 StanfordSource, GeneCards | villin 1 | 3771 | 0.207 | -0.0460 | No |
| 9 | C2orf24 | 4493 | 0.117 | -0.1080 | No | ||
| 10 | RQCD1 | RQCD1 StanfordSource, GeneCards | RCD1 required for cell differentiation1 homolog (S. pombe) | 4566 | 0.107 | -0.1060 | No |
| 11 | CYP27A1 | CYP27A1 StanfordSource, GeneCards | cytochrome P450, family 27, subfamily A, polypeptide 1 | 4584 | 0.106 | -0.0987 | No |
| 12 | INHA | INHA StanfordSource, GeneCards | inhibin, alpha | 4645 | 0.098 | -0.0964 | No |
| 13 | TTLL4 | TTLL4 StanfordSource, GeneCards | Tubulin tyrosine ligase-like family, member 4 | 5070 | 0.048 | -0.1346 | No |
| 14 | STK16 | STK16 StanfordSource, GeneCards | serine/threonine kinase 16 | 5112 | 0.043 | -0.1350 | No |
| 15 | BCS1L | BCS1L StanfordSource, GeneCards | BCS1-like (yeast) | 5142 | 0.039 | -0.1345 | No |
| 16 | AAMP | AAMP StanfordSource, GeneCards | angio-associated, migratory cell protein | 5461 | -0.000 | -0.1662 | No |
| 17 | DNAJB2 | DNAJB2 StanfordSource, GeneCards | DnaJ (Hsp40) homolog, subfamily B, member 2 | 6865 | -0.164 | -0.2923 | No |
| 18 | IL8RA | IL8RA StanfordSource, GeneCards | interleukin 8 receptor, alpha | 7490 | -0.230 | -0.3349 | Yes |
| 19 | IGFBP2 | IGFBP2 StanfordSource, GeneCards | insulin-like growth factor binding protein 2, 36kDa | 7536 | -0.236 | -0.3193 | Yes |
| 20 | IGFBP5 | IGFBP5 StanfordSource, GeneCards | insulin-like growth factor binding protein 5 | 7761 | -0.266 | -0.3190 | Yes |
| 21 | FN1 | FN1 StanfordSource, GeneCards | fibronectin 1 | 8106 | -0.313 | -0.3267 | Yes |
| 22 | TNP1 | TNP1 StanfordSource, GeneCards | transition protein 1 (during histone to protamine replacement) | 8372 | -0.361 | -0.3224 | Yes |
| 23 | SLC4A3 | SLC4A3 StanfordSource, GeneCards | solute carrier family 4, anion exchanger, member 3 | 8694 | -0.426 | -0.3182 | Yes |
| 24 | FEV | FEV StanfordSource, GeneCards | FEV (ETS oncogene family) | 8991 | -0.485 | -0.3064 | Yes |
| 25 | PTPRN | PTPRN StanfordSource, GeneCards | protein tyrosine phosphatase, receptor type, N | 9212 | -0.536 | -0.2827 | Yes |
| 26 | CDK5R2 | CDK5R2 StanfordSource, GeneCards | cyclin-dependent kinase 5, regulatory subunit 2 (p39) | 9443 | -0.604 | -0.2542 | Yes |
| 27 | IHH | IHH StanfordSource, GeneCards | Indian hedgehog homolog (Drosophila) | 9470 | -0.615 | -0.2044 | Yes |
| 28 | ARPC2 | ARPC2 StanfordSource, GeneCards | actin related protein 2/3 complex, subunit 2, 34kDa | 9490 | -0.621 | -0.1534 | Yes |
| 29 | IL8RB | IL8RB StanfordSource, GeneCards | interleukin 8 receptor, beta | 9536 | -0.641 | -0.1034 | Yes |
| 30 | WNT6 | WNT6 StanfordSource, GeneCards | wingless-type MMTV integration site family, member 6 | 9880 | -0.825 | -0.0674 | Yes |
| 31 | SLC11A1 | SLC11A1 StanfordSource, GeneCards | solute carrier family 11 (proton-coupled divalent metal ion transporters), member 1 | 10004 | -0.995 | 0.0051 | Yes |