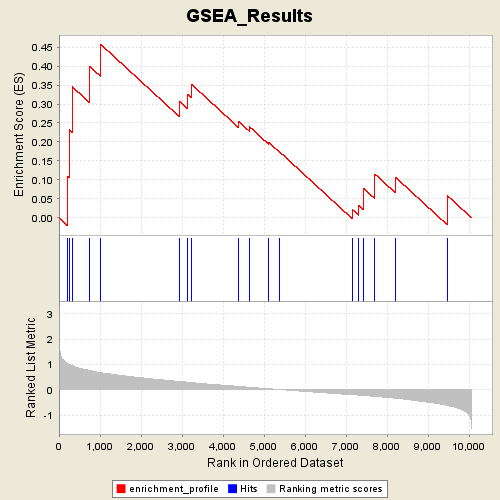
Profile of the Running ES Score & Positions of GeneSet Members on the Rank Ordered List
| Dataset | Leukemia_collapsed.gct |
| Phenotype | ALL |
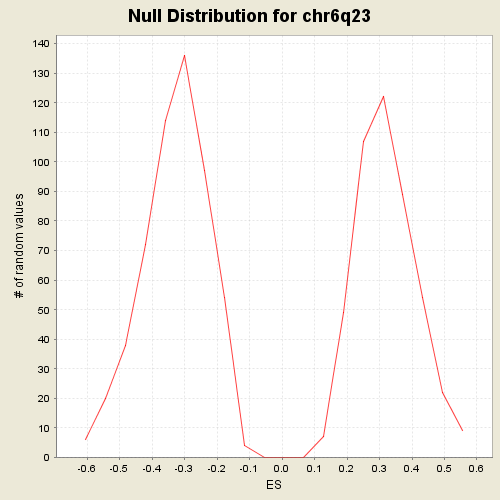
| GeneSet | C1.symbols.gmt#chr6q23 |
| Enrichment Score (ES) | 0.45764026 |
| Normalized Enrichment Score (NES) | 1.4307455 |
| Nominal p-value | 0.069716774 |
| FDR q-value | 0.5439272 |
| FWER p-Value | 0.878 |
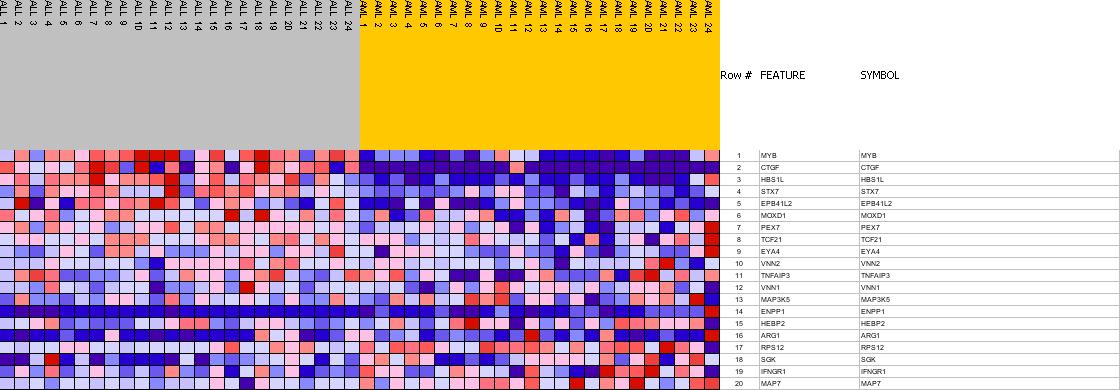
| PROBE | GENE SYMBOL | GENE_TITLE | RANK IN GENE LIST | RANK METRIC SCORE | RES | CORE_ENRICHMENT | |
|---|---|---|---|---|---|---|---|
| 1 | MYB | MYB StanfordSource, GeneCards | v-myb myeloblastosis viral oncogene homolog (avian) | 218 | 1.032 | 0.1086 | Yes |
| 2 | CTGF | CTGF StanfordSource, GeneCards | connective tissue growth factor | 245 | 1.007 | 0.2331 | Yes |
| 3 | HBS1L | HBS1L StanfordSource, GeneCards | HBS1-like (S. cerevisiae) | 318 | 0.951 | 0.3461 | Yes |
| 4 | STX7 | STX7 StanfordSource, GeneCards | syntaxin 7 | 750 | 0.762 | 0.3993 | Yes |
| 5 | EPB41L2 | EPB41L2 StanfordSource, GeneCards | erythrocyte membrane protein band 4.1-like 2 | 1017 | 0.672 | 0.4576 | Yes |
| 6 | MOXD1 | MOXD1 StanfordSource, GeneCards | monooxygenase, DBH-like 1 | 2938 | 0.325 | 0.3074 | No |
| 7 | PEX7 | PEX7 StanfordSource, GeneCards | peroxisomal biogenesis factor 7 | 3129 | 0.300 | 0.3263 | No |
| 8 | TCF21 | TCF21 StanfordSource, GeneCards | transcription factor 21 | 3231 | 0.285 | 0.3521 | No |
| 9 | EYA4 | EYA4 StanfordSource, GeneCards | eyes absent homolog 4 (Drosophila) | 4385 | 0.131 | 0.2537 | No |
| 10 | VNN2 | VNN2 StanfordSource, GeneCards | vanin 2 | 4652 | 0.097 | 0.2395 | No |
| 11 | TNFAIP3 | TNFAIP3 StanfordSource, GeneCards | tumor necrosis factor, alpha-induced protein 3 | 5111 | 0.043 | 0.1993 | No |
| 12 | VNN1 | VNN1 StanfordSource, GeneCards | vanin 1 | 5384 | 0.009 | 0.1733 | No |
| 13 | MAP3K5 | MAP3K5 StanfordSource, GeneCards | mitogen-activated protein kinase kinase kinase 5 | 7154 | -0.195 | 0.0217 | No |
| 14 | ENPP1 | ENPP1 StanfordSource, GeneCards | ectonucleotide pyrophosphatase/phosphodiesterase 1 | 7303 | -0.209 | 0.0333 | No |
| 15 | HEBP2 | HEBP2 StanfordSource, GeneCards | heme binding protein 2 | 7422 | -0.223 | 0.0497 | No |
| 16 | ARG1 | ARG1 StanfordSource, GeneCards | arginase, liver | 7433 | -0.224 | 0.0770 | No |
| 17 | RPS12 | RPS12 StanfordSource, GeneCards | ribosomal protein S12 | 7701 | -0.257 | 0.0828 | No |
| 18 | SGK | SGK StanfordSource, GeneCards | serum/glucocorticoid regulated kinase | 7704 | -0.257 | 0.1151 | No |
| 19 | IFNGR1 | IFNGR1 StanfordSource, GeneCards | interferon gamma receptor 1 | 8205 | -0.329 | 0.1069 | No |
| 20 | MAP7 | MAP7 StanfordSource, GeneCards | microtubule-associated protein 7 | 9467 | -0.613 | 0.0586 | No |