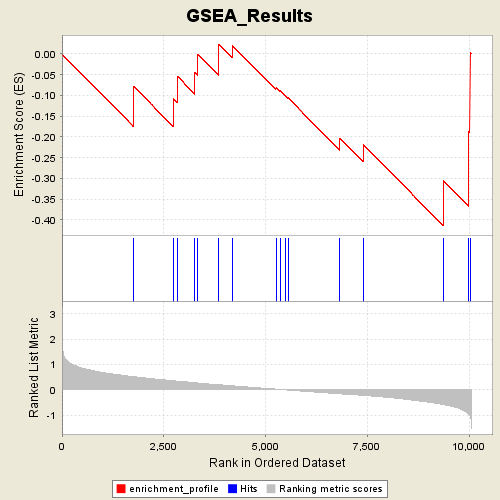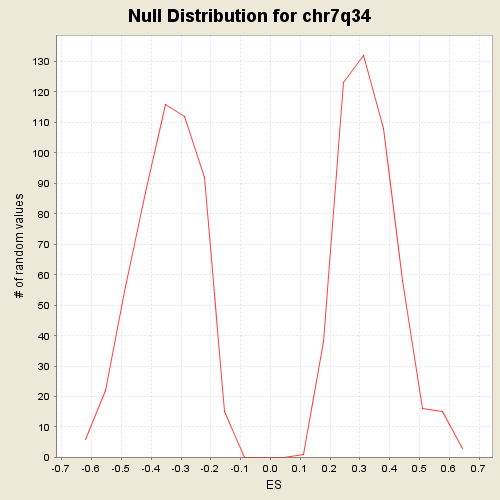
Profile of the Running ES Score & Positions of GeneSet Members on the Rank Ordered List
| Dataset | Leukemia_collapsed.gct |
| Phenotype | AML |
| GeneSet | C1.symbols.gmt#chr7q34 |
| Enrichment Score (ES) | -0.4146928 |
| Normalized Enrichment Score (NES) | -1.1932477 |
| Nominal p-value | 0.26284584 |
| FDR q-value | 1.0 |
| FWER p-Value | 0.983 |
| PROBE | GENE SYMBOL | GENE_TITLE | RANK IN GENE LIST | RANK METRIC SCORE | RES | CORE_ENRICHMENT | |
|---|---|---|---|---|---|---|---|
| 1 | HIPK2 | HIPK2 StanfordSource, GeneCards | homeodomain interacting protein kinase 2 | 1758 | 0.516 | -0.0780 | No |
| 2 | SSBP1 | SSBP1 StanfordSource, GeneCards | single-stranded DNA binding protein 1 | 2731 | 0.357 | -0.1076 | No |
| 3 | CLCN1 | CLCN1 StanfordSource, GeneCards | chloride channel 1, skeletal muscle (Thomsen disease, autosomal dominant) | 2838 | 0.339 | -0.0543 | No |
| 4 | TIF1 | TIF1 StanfordSource, GeneCards | transcriptional intermediary factor 1 | 3264 | 0.280 | -0.0440 | No |
| 5 | EPHA1 | EPHA1 StanfordSource, GeneCards | EphA1 | 3335 | 0.269 | -0.0003 | No |
| 6 | PIP | PIP StanfordSource, GeneCards | prolactin-induced protein | 3850 | 0.199 | -0.0140 | No |
| 7 | AKR1D1 | AKR1D1 StanfordSource, GeneCards | aldo-keto reductase family 1, member D1 (delta 4-3-ketosteroid-5-beta-reductase) | 3852 | 0.199 | 0.0234 | No |
| 8 | TRPV6 | TRPV6 StanfordSource, GeneCards | transient receptor potential cation channel, subfamily V, member 6 | 4176 | 0.159 | 0.0211 | No |
| 9 | MKRN1 | MKRN1 StanfordSource, GeneCards | makorin, ring finger protein, 1 | 5255 | 0.026 | -0.0815 | No |
| 10 | MGAM | MGAM StanfordSource, GeneCards | maltase-glucoamylase (alpha-glucosidase) | 5356 | 0.012 | -0.0892 | No |
| 11 | BRAF | BRAF StanfordSource, GeneCards | v-raf murine sarcoma viral oncogene homolog B1 | 5498 | -0.004 | -0.1025 | No |
| 12 | EPHB6 | EPHB6 StanfordSource, GeneCards | EphB6 | 5551 | -0.009 | -0.1059 | No |
| 13 | KEL | KEL StanfordSource, GeneCards | Kell blood group | 6825 | -0.159 | -0.2028 | No |
| 14 | PRSS2 | PRSS2 StanfordSource, GeneCards | protease, serine, 2 (trypsin 2) | 7393 | -0.219 | -0.2181 | No |
| 15 | TBXAS1 | TBXAS1 StanfordSource, GeneCards | thromboxane A synthase 1 (platelet, cytochrome P450, family 5, subfamily A) | 9368 | -0.580 | -0.3055 | Yes |
| 16 | CASP2 | CASP2 StanfordSource, GeneCards | caspase 2, apoptosis-related cysteine protease (neural precursor cell expressed, developmentally down-regulated 2) | 9985 | -0.954 | -0.1873 | Yes |
| 17 | ZYX | ZYX StanfordSource, GeneCards | zyxin | 10018 | -1.032 | 0.0037 | Yes |


