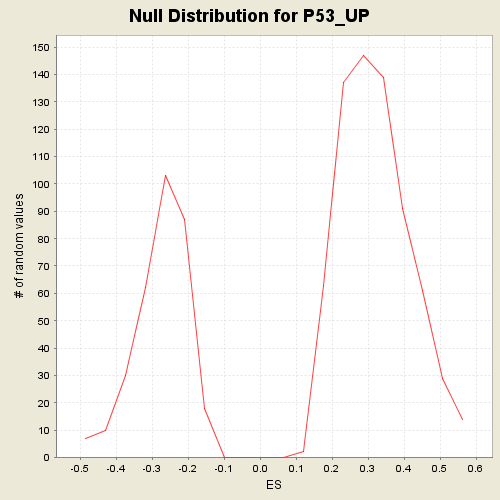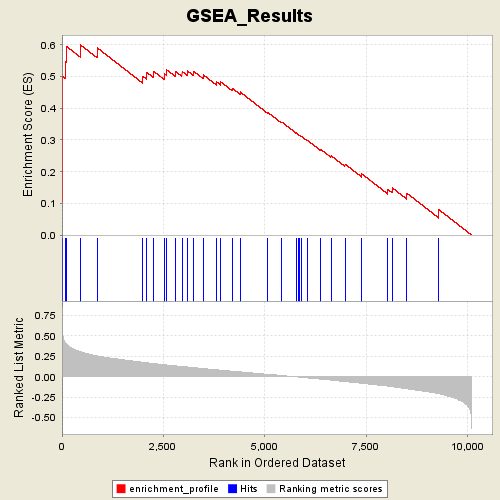
Profile of the Running ES Score & Positions of GeneSet Members on the Rank Ordered List
| Dataset | p53_full_useme_maxed_cs.gct |
| Phenotype | WT |
| GeneSet | s2.symbols.gmt#P53_UP |
| Enrichment Score (ES) | 0.5995161 |
| Normalized Enrichment Score (NES) | 1.8757944 |
| Nominal p-value | 0.0 |
| FDR q-value | 0.065383784 |
| FWER p-Value | 0.195 |
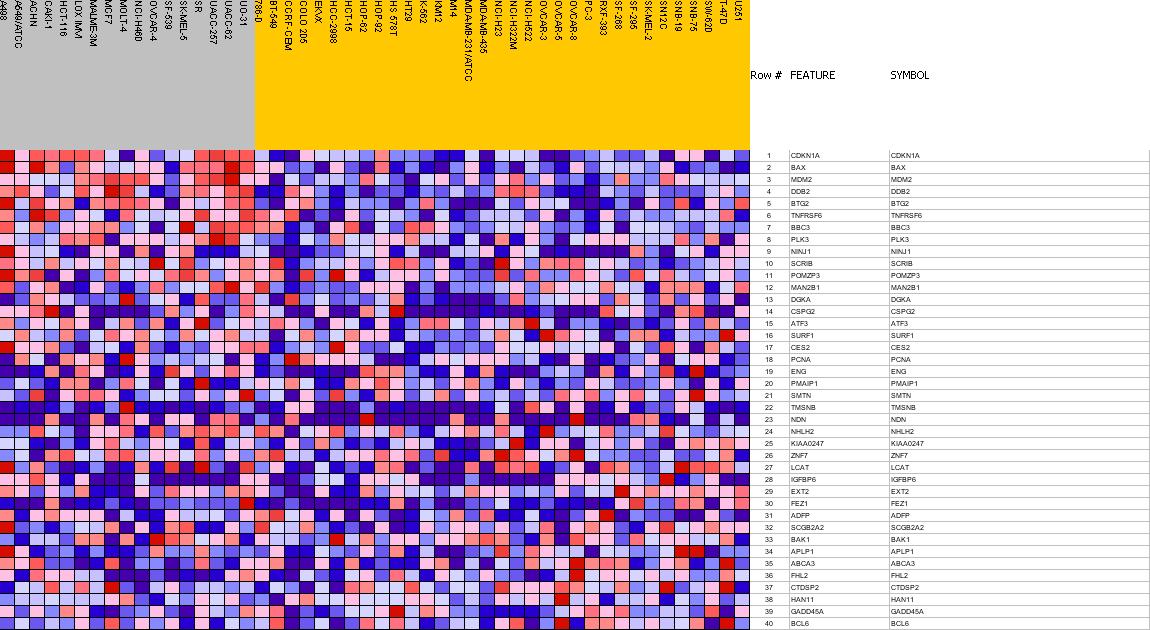
| PROBE | GENE SYMBOL | GENE_TITLE | RANK IN GENE LIST | RANK METRIC SCORE | RES | CORE_ENRICHMENT | |
|---|---|---|---|---|---|---|---|
| 1 | CDKN1A | CDKN1A StanfordSource, GeneCards | cyclin-dependent kinase inhibitor 1A (p21, Cip1) | 0 | 0.843 | 0.1068 | Yes |
| 2 | BAX | BAX StanfordSource, GeneCards | BCL2-associated X protein | 1 | 0.823 | 0.2112 | Yes |
| 3 | MDM2 | MDM2 StanfordSource, GeneCards | Mdm2, transformed 3T3 cell double minute 2, p53 binding protein (mouse) | 2 | 0.631 | 0.2912 | Yes |
| 4 | DDB2 | DDB2 StanfordSource, GeneCards | damage-specific DNA binding protein 2, 48kDa | 4 | 0.595 | 0.3665 | Yes |
| 5 | BTG2 | BTG2 StanfordSource, GeneCards | BTG family, member 2 | 9 | 0.567 | 0.4380 | Yes |
| 6 | TNFRSF6 | TNFRSF6 StanfordSource, GeneCards | tumor necrosis factor receptor superfamily, member 6 | 23 | 0.494 | 0.4994 | Yes |
| 7 | BBC3 | BBC3 StanfordSource, GeneCards | BCL2 binding component 3 | 79 | 0.416 | 0.5467 | Yes |
| 8 | PLK3 | PLK3 StanfordSource, GeneCards | polo-like kinase 3 (Drosophila) | 108 | 0.400 | 0.5946 | Yes |
| 9 | NINJ1 | NINJ1 StanfordSource, GeneCards | ninjurin 1 | 450 | 0.306 | 0.5995 | Yes |
| 10 | SCRIB | SCRIB StanfordSource, GeneCards | scribble | 866 | 0.252 | 0.5902 | No |
| 11 | POMZP3 | POMZP3 StanfordSource, GeneCards | POM (POM121 homolog, rat) and ZP3 fusion | 1993 | 0.175 | 0.5005 | No |
| 12 | MAN2B1 | MAN2B1 StanfordSource, GeneCards | mannosidase, alpha, class 2B, member 1 | 2090 | 0.169 | 0.5125 | No |
| 13 | DGKA | DGKA StanfordSource, GeneCards | diacylglycerol kinase, alpha 80kDa | 2256 | 0.159 | 0.5162 | No |
| 14 | CSPG2 | CSPG2 StanfordSource, GeneCards | chondroitin sulfate proteoglycan 2 (versican) | 2526 | 0.145 | 0.5079 | No |
| 15 | ATF3 | ATF3 StanfordSource, GeneCards | activating transcription factor 3 | 2574 | 0.142 | 0.5213 | No |
| 16 | SURF1 | SURF1 StanfordSource, GeneCards | surfeit 1 | 2790 | 0.131 | 0.5166 | No |
| 17 | CES2 | CES2 StanfordSource, GeneCards | carboxylesterase 2 (intestine, liver) | 2960 | 0.123 | 0.5154 | No |
| 18 | PCNA | PCNA StanfordSource, GeneCards | proliferating cell nuclear antigen | 3090 | 0.117 | 0.5174 | No |
| 19 | ENG | ENG StanfordSource, GeneCards | endoglin (Osler-Rendu-Weber syndrome 1) | 3250 | 0.109 | 0.5154 | No |
| 20 | PMAIP1 | PMAIP1 StanfordSource, GeneCards | phorbol-12-myristate-13-acetate-induced protein 1 | 3490 | 0.098 | 0.5041 | No |
| 21 | SMTN | SMTN StanfordSource, GeneCards | smoothelin | 3816 | 0.083 | 0.4824 | No |
| 22 | TMSNB | TMSNB StanfordSource, GeneCards | thymosin, beta, identified in neuroblastoma cells | 3917 | 0.078 | 0.4823 | No |
| 23 | NDN | NDN StanfordSource, GeneCards | necdin homolog (mouse) | 4197 | 0.066 | 0.4629 | No |
| 24 | NHLH2 | NHLH2 StanfordSource, GeneCards | nescient helix loop helix 2 | 4394 | 0.057 | 0.4507 | No |
| 25 | KIAA0247 | KIAA0247 StanfordSource, GeneCards | KIAA0247 | 5070 | 0.028 | 0.3871 | No |
| 26 | ZNF7 | ZNF7 StanfordSource, GeneCards | zinc finger protein 7 (KOX 4, clone HF.16) | 5407 | 0.014 | 0.3554 | No |
| 27 | LCAT | LCAT StanfordSource, GeneCards | lecithin-cholesterol acyltransferase | 5422 | 0.013 | 0.3557 | No |
| 28 | IGFBP6 | IGFBP6 StanfordSource, GeneCards | insulin-like growth factor binding protein 6 | 5772 | -0.003 | 0.3214 | No |
| 29 | EXT2 | EXT2 StanfordSource, GeneCards | exostoses (multiple) 2 | 5833 | -0.005 | 0.3161 | No |
| 30 | FEZ1 | FEZ1 StanfordSource, GeneCards | fasciculation and elongation protein zeta 1 (zygin I) | 5867 | -0.007 | 0.3137 | No |
| 31 | ADFP | ADFP StanfordSource, GeneCards | adipose differentiation-related protein | 5898 | -0.008 | 0.3118 | No |
| 32 | SCGB2A2 | SCGB2A2 StanfordSource, GeneCards | secretoglobin, family 2A, member 2 | 6048 | -0.015 | 0.2989 | No |
| 33 | BAK1 | BAK1 StanfordSource, GeneCards | BCL2-antagonist/killer 1 | 6374 | -0.031 | 0.2705 | No |
| 34 | APLP1 | APLP1 StanfordSource, GeneCards | amyloid beta (A4) precursor-like protein 1 | 6634 | -0.042 | 0.2501 | No |
| 35 | ABCA3 | ABCA3 StanfordSource, GeneCards | ATP-binding cassette, sub-family A (ABC1), member 3 | 6979 | -0.060 | 0.2236 | No |
| 36 | FHL2 | FHL2 StanfordSource, GeneCards | four and a half LIM domains 2 | 7392 | -0.081 | 0.1929 | No |
| 37 | CTDSP2 | CTDSP2 StanfordSource, GeneCards | CTD (carboxy-terminal domain, RNA polymerase II, polypeptide A) small phosphatase 2 | 8037 | -0.116 | 0.1436 | No |
| 38 | HAN11 | HAN11 StanfordSource, GeneCards | WD-repeat protein | 8147 | -0.123 | 0.1484 | No |
| 39 | GADD45A | GADD45A StanfordSource, GeneCards | growth arrest and DNA-damage-inducible, alpha | 8507 | -0.149 | 0.1316 | No |
| 40 | BCL6 | BCL6 StanfordSource, GeneCards | B-cell CLL/lymphoma 6 (zinc finger protein 51) | 9295 | -0.209 | 0.0799 | No |