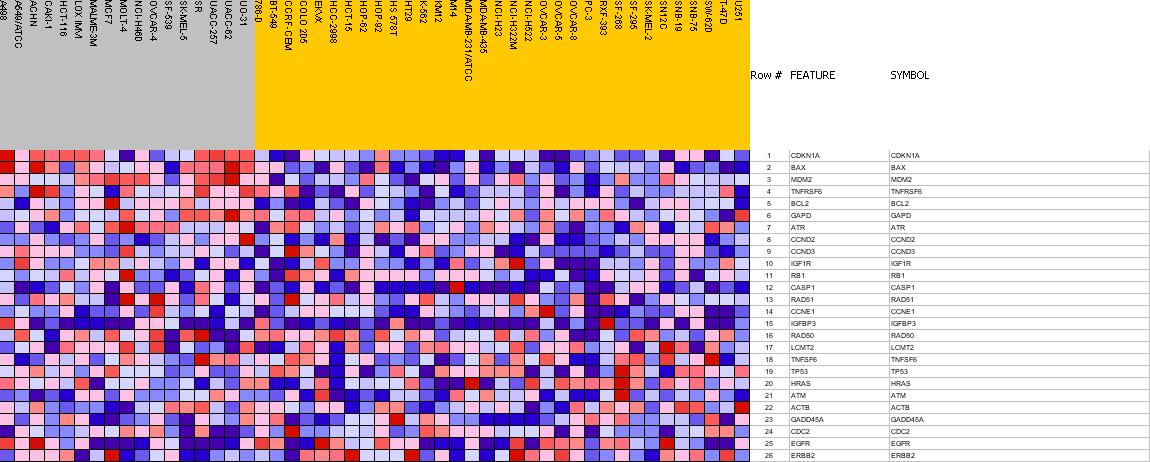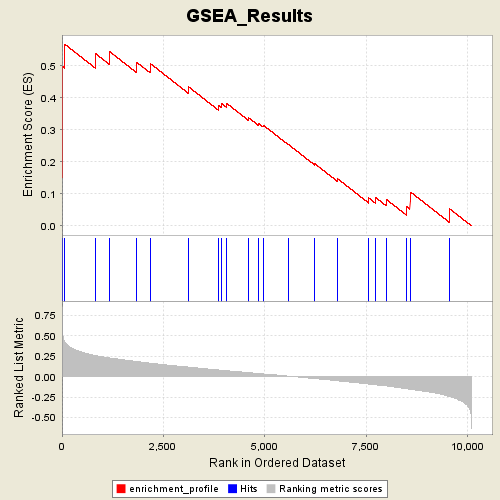
Profile of the Running ES Score & Positions of GeneSet Members on the Rank Ordered List
| Dataset | p53_full_useme_maxed_cs.gct |
| Phenotype | WT |
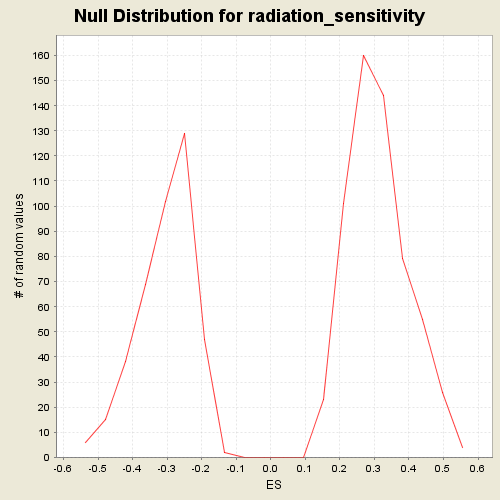
| GeneSet | s2.symbols.gmt#radiation_sensitivity |
| Enrichment Score (ES) | 0.5673681 |
| Normalized Enrichment Score (NES) | 1.8265389 |
| Nominal p-value | 0.0016891892 |
| FDR q-value | 0.088138245 |
| FWER p-Value | 0.296 |
| PROBE | GENE SYMBOL | GENE_TITLE | RANK IN GENE LIST | RANK METRIC SCORE | RES | CORE_ENRICHMENT | |
|---|---|---|---|---|---|---|---|
| 1 | CDKN1A | CDKN1A StanfordSource, GeneCards | cyclin-dependent kinase inhibitor 1A (p21, Cip1) | 0 | 0.843 | 0.1507 | Yes |
| 2 | BAX | BAX StanfordSource, GeneCards | BCL2-associated X protein | 1 | 0.823 | 0.2979 | Yes |
| 3 | MDM2 | MDM2 StanfordSource, GeneCards | Mdm2, transformed 3T3 cell double minute 2, p53 binding protein (mouse) | 2 | 0.631 | 0.4106 | Yes |
| 4 | TNFRSF6 | TNFRSF6 StanfordSource, GeneCards | tumor necrosis factor receptor superfamily, member 6 | 23 | 0.494 | 0.4970 | Yes |
| 5 | BCL2 | BCL2 StanfordSource, GeneCards | B-cell CLL/lymphoma 2 | 71 | 0.420 | 0.5674 | Yes |
| 6 | GAPD | GAPD StanfordSource, GeneCards | glyceraldehyde-3-phosphate dehydrogenase | 823 | 0.257 | 0.5387 | No |
| 7 | ATR | ATR StanfordSource, GeneCards | ataxia telangiectasia and Rad3 related | 1182 | 0.227 | 0.5438 | No |
| 8 | CCND2 | CCND2 StanfordSource, GeneCards | cyclin D2 | 1849 | 0.184 | 0.5106 | No |
| 9 | CCND3 | CCND3 StanfordSource, GeneCards | cyclin D3 | 2175 | 0.164 | 0.5076 | No |
| 10 | IGF1R | IGF1R StanfordSource, GeneCards | insulin-like growth factor 1 receptor | 3110 | 0.116 | 0.4357 | No |
| 11 | RB1 | RB1 StanfordSource, GeneCards | retinoblastoma 1 (including osteosarcoma) | 3854 | 0.081 | 0.3764 | No |
| 12 | CASP1 | CASP1 StanfordSource, GeneCards | caspase 1, apoptosis-related cysteine protease (interleukin 1, beta, convertase) | 3930 | 0.077 | 0.3828 | No |
| 13 | RAD51 | RAD51 StanfordSource, GeneCards | RAD51 homolog (RecA homolog, E. coli) (S. cerevisiae) | 4055 | 0.072 | 0.3834 | No |
| 14 | CCNE1 | CCNE1 StanfordSource, GeneCards | cyclin E1 | 4602 | 0.049 | 0.3379 | No |
| 15 | IGFBP3 | IGFBP3 StanfordSource, GeneCards | insulin-like growth factor binding protein 3 | 4838 | 0.038 | 0.3214 | No |
| 16 | RAD50 | RAD50 StanfordSource, GeneCards | RAD50 homolog (S. cerevisiae) | 4960 | 0.032 | 0.3152 | No |
| 17 | LCMT2 | LCMT2 StanfordSource, GeneCards | leucine carboxyl methyltransferase 2 | 5580 | 0.006 | 0.2548 | No |
| 18 | TNFSF6 | TNFSF6 StanfordSource, GeneCards | tumor necrosis factor (ligand) superfamily, member 6 | 6238 | -0.024 | 0.1939 | No |
| 19 | TP53 | TP53 StanfordSource, GeneCards | tumor protein p53 (Li-Fraumeni syndrome) | 6783 | -0.050 | 0.1489 | No |
| 20 | HRAS | HRAS StanfordSource, GeneCards | v-Ha-ras Harvey rat sarcoma viral oncogene homolog | 7563 | -0.090 | 0.0877 | No |
| 21 | ATM | ATM StanfordSource, GeneCards | ataxia telangiectasia mutated (includes complementation groups A, C and D) | 7735 | -0.100 | 0.0887 | No |
| 22 | ACTB | ACTB StanfordSource, GeneCards | actin, beta | 7993 | -0.114 | 0.0835 | No |
| 23 | GADD45A | GADD45A StanfordSource, GeneCards | growth arrest and DNA-damage-inducible, alpha | 8507 | -0.149 | 0.0593 | No |
| 24 | CDC2 | CDC2 StanfordSource, GeneCards | cell division cycle 2, G1 to S and G2 to M | 8582 | -0.154 | 0.0795 | No |
| 25 | EGFR | EGFR StanfordSource, GeneCards | epidermal growth factor receptor (erythroblastic leukemia viral (v-erb-b) oncogene homolog, avian) | 8599 | -0.156 | 0.1057 | No |
| 26 | ERBB2 | ERBB2 StanfordSource, GeneCards | v-erb-b2 erythroblastic leukemia viral oncogene homolog 2, neuro/glioblastoma derived oncogene homolog (avian) | 9547 | -0.241 | 0.0548 | No |