BUHMBOX manual
<< Go back to BUHMBOX main homepage
Prerequisite
1. PLINK and R installed in the system
2. Disease A cases and controls: plink format.
3. List of disease B associated loci (with risk alleles, risk allele frequencies, and odds ratios)
4. Principal components, if available.
Running steps
- Prepare LD-pruned disease B associated loci "SNP File"
Column 1: RSID, Column 2: risk allele, Column 3: risk allele frequency, Column 4: Odds ratio
rs2843401   G   0.6718  1.1
rs2301888   G   0.6515  1.11
rs2306627   A   0.3005  1.1
rs883220    C   0.7508  1.11
rs2476601   A   0.09966 1.8
Note: everything has to be "risk allele", not protective allele! Thus, OR will be always >1.0. -- Update(11/19/15): As of v0.37, this restriction is deprecated; you can put in protective alleles (OR<1). BUHMBOX will automatically flip them internally.
Note: Column 3 and 4 can be "NA" in which case it will be mean-value-imputed.
Note: Recommended value for LD pruning is r2=0.1
If you are using PLINK assoc file, you can use clumping: e.g. --clump ASSOCFILE --clump-r2 0.1 --clump-kb 10000
If you are using SNP list, you can use pruning: e.g. --extract SNPLIST --indep-pairwise 50 5 0.1 --filter-controls
Note: For LD pruning, I recommend using only controls for LD calculation, becaues correlations in cases might include the artificial correlations that we want to detect, which was caused by heterogeneity.
Note: Allele frequency is control allele frequency, but using case or all sample frequency (or reported allele frequency in literature) doesn't affect results much.
- Extract disease B associated loci from plink data (dosage RAW format, case/control separately.)
Given the SNP File from Step 2, we will only need the first two columns: for example in unix, you can
cut -f1-2 SNPFILE > SNPFILE2
Then let's extract dosage raw format
  plink --noweb --allow-no-sex --bfile YOURPLINKFILE --filter-controls --extract SNPFILE2 --reference-allele SNPFILE2 --recodeA --out CONTROLRAWFILE

  plink --noweb --allow-no-sex --bfile YOURPLINKFILE --filter-cases --extract SNPFILE2 --reference-allele SNPFILE2 --recodeA --out CASERAWFILE
Of course, you can use --keep INDIVIDUALFILE if you want to use individual ID file to filter out cases/conrols, instead of --filter-controls or --filter-cases.
-
Run BUHMBOX
Rscript buhmbox.R SNPFile CASERAWFILE CONTROLRAWFILE YY N Y OUTPUT [PCFILE]
Details of Arguments:
| 1 |
SNPFile |
The SNP File we generated at Step 1. (four-column format) |
| 2 |
CASERAWFILE |
The plink dosage raw format of cases. Likely has extension of .raw |
| 3 |
CONTROLRAWFILE |
The plink dosage raw format of controls. Likely has extension of .raw |
| 4 |
Method mode |
Each of two letters represents freq mode, and OR mode.
YY: use both freq and OR; YN: use only freq;
NY: use only OR; NN: use neither.
If freq / OR are not used, default values 0.5 / 1.2 are used for all SNPs.
For typical situations, use default "YY".
(Other modes are used to evaluate power of method, if some information is ignored.)
|
| 5 |
Estimation mode |
"Y": perform estimation -- BUHMBOX estimates proportion of disease-B cases that are misclassified in disease A cases.
"N": do not perfom estimation. (much faster.)
Default is "N" for efficiency. Use "Y" if you observe interesting results and do further analysis.
|
| 6 |
Mendelian randomization |
"Y": perform Mendelian randomization (risk score approach) -- using the risk alleles, BUHMBOX will calculate genetic risk score of each individual (based on disease B risk alleles) and associates the score to the disease A status, to calculate p-value. (PC accounted, if provided.)
"N": don't perform Mendelian randomization.
|
| 7 |
OUTPUT File |
Output file name |
| 8 |
PC File (Optional) |
Optional PC File. First column: FID, Second column: IID, and other columns: PCs. BUHMBOX compares FID and IID to match individuals. Thus, (1) PC File individuals don't have to be in the same order as in plink file, and (2) PC File may contain extra individuals. (not used anyways) |
Notes:
- SNP sets in two RAW files must be the same. (They will be, if you followed steps correctly)
- SNP sets in SNPFile and RAW files don't have to be the same. SNPs not in both SNPFile and RAW files are automatically removed. This will be useful if you want to look at results for different SNP sets. You can generate SNPFile and RAWFiles assuming the largest possible set of SNPs, and then reduce only SNPFile. For instance, if you want to use just subset of SNPs defined in SNPFile, you can define a new SNPFile with those SNPs and use it.
Output
In output result file:
| PVALUE |
BUHMBOX p-value. If significant, it indicates excessive positive correlations than expected. |
| LOG10P |
Log10 of PVALUE |
| N |
The number of case individuals that were used in calculation. (After internal QC, which may have removed some individuals due to e.g. missing alleles |
| ZSCORE |
BUHMBOX Z-score |
| MLE.LEFT |
Maximum likelihood estimation of misclassification rate, between 0-50% |
| LL.LEFT |
Log likelihood of MLE.LEFT |
| MLE.RIGHT |
Maximum likelihood estimation of misclassification rate, between 50-100% |
| LL.RIGHT |
Log likelihood of MLE.RIGHT |
| MR.PVALUE |
Mendelian randomization (risk score approach) p-value |
| MR.LOG10P |
Log10 of MR.PVALUE |
| MR.BETA |
Beta of Mendelian randomization |
| MR.STDERR |
Standard error of MR.BETA |
Notes:
- MLE.* and LL.* are only reported if Estimation argument is "Y"
- MR.* are only reported if Mendelian randomization argument is "Y"
- MLE and LL have LEFT and RIGHT, because likelihood function has two modes. (20% misclassification and 80% misclassification have very similar likelihood)
- Meta-analysis: You can meta-analyze multiple studies using ZSCORE and N (weighted z-score approach)
Also you will find a log file that captures the progress report.
Interpretation
If BUHMBOX P-value is significant, it indicates that the disease-B-loci are excessively positive correlated in disease A cases than expected. This might be due to
- Heterogeneity (Subgrouping): there are subgroups within disease A cases, one with higher frequency of disease B risk alleles, and one with lower frequency.
This might be due to:
- Misclassification / Misdiagnosis: some individuals are actually disease B rather than disease A, but they are currently misclassified as disease A.
- Cormobidity / causal relationship: some individuals are actually cormobid of both disease A and B. This has causal implication that disease B induces disease A. (If disease A induces disease B, we will not see subgrouping...)
- Pleiotropy + Interaction: If disease B loci are also disease A loci (pleiotropy) and at the same time, if those loci have positive interaction, then we'll see positive correlations. For this to happen, both pleiotropy and interaction have to occur, but certainly not impossible.
- Unaccounted factor that affects genomic stratification: not impossible, but unlikely due to PC regression. Moreover, in this case, both positive and negative correlations will occur, which will cancel out in our aggregated statistic.
- Unaccounted LD: not impossible, but unlikely because we use harsh LD pruning (r2<0.1) and also account for the remaining very small LD by using control samples (that's why we require controls). In this case as well, both positive and negative correlations will occur which will be cancel out.
If BUHMBOX P-value is not significant (while Mendelian randomization is significant), it might be due to
- Pure pleiotropy (Mendelian randomization is significant because disease B loci are also disease A loci), and no misclassification/comorbidity. Pure pleiotropy does not induce positive correlations.
- Subgrouping rather than pleiotropy, but we don't have sufficient power for BUHMBOX. (small number of SNPs, small sample size, small heterogeneity proportion, etc)
Frequently Asked Questions
1. What if both pleiotropy and heterogeneity exist? What happens?
2. How many SNPs / how large samples are needed for BUHMBOX?
3. Does BUHMBOX work for polygenic model? (using moderately significant SNPs)
1. What if both pleiotropy and heterogeneity exist? What happens?
BUHMBOX detects heterogeneity regardless of pleiotropy.
If both exist, and if BUHMBOX has sufficient power, BUHMBOX will reject the null due to heterogeneity.
Note that if BUHMBOX rejects null, it's not evidence of "absence of pleiotropy".
See the following comparison:
BUHMBOX:
No pleiotropy, No heterogeneity: Null
No pleiotropy, Yes heterogeneity: Alternative
Yes pleiotropy, No heterogeneity: Null
Yes pleiotropy, Yes heterogeneity: Alternative
Mendelian randomization:
No pleiotropy, No heterogeneity: Null
No pleiotropy, Yes heterogeneity: Alternative
Yes pleiotropy, No heterogeneity: Alternative
Yes pleiotropy, Yes heterogeneity: Alternative
2. How many SNPs / how large samples are needed for BUHMBOX?
Please refer to the following graphs:(based on risk alelle frequency and odds ratio sampled from GWAS catalog)
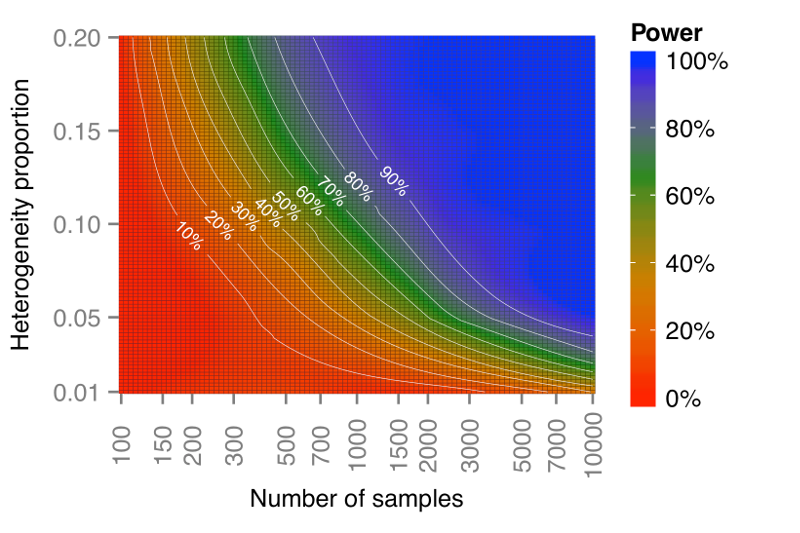
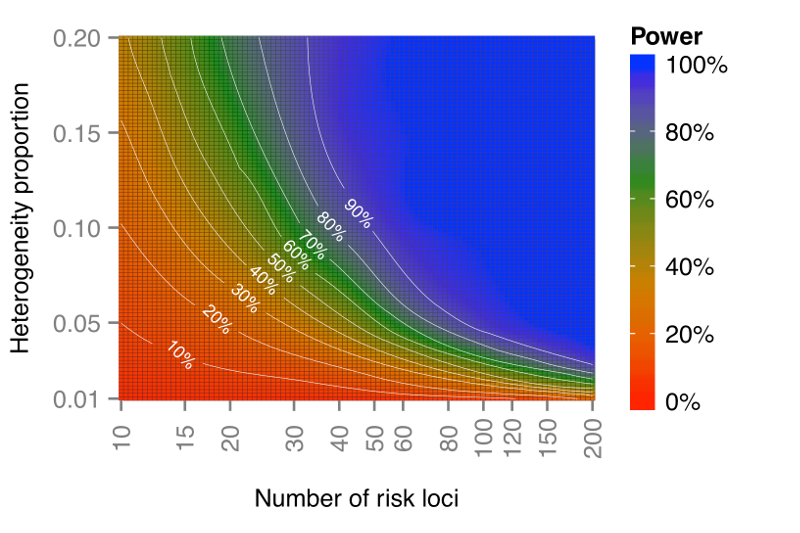
The first plot is when #SNPs=50, and the second plot is when #samples=2000.
This shows that BUHMBOX has plenty of power in practical situations of current studies for many diseases.
3. Does BUHMBOX work for polygenic model? (using moderately significant SNPs)
By simulations and real data, we found that BUHMBOX can often gain power by using more SNPs that did not meet GWAS threshold (5E-8). For example you can use all SNPs that are < 1E-6. When aggregating correlations into a statistic, BUHMBOX accounts for odds ratio and frequencies. Thus, rarer SNPs or SNPs with small effects will be downweighted. That's why adding more and more moderately significant SNPs does not hurt BUHMBOX much, but often helps.
<< Go back to BUHMBOX main homepage