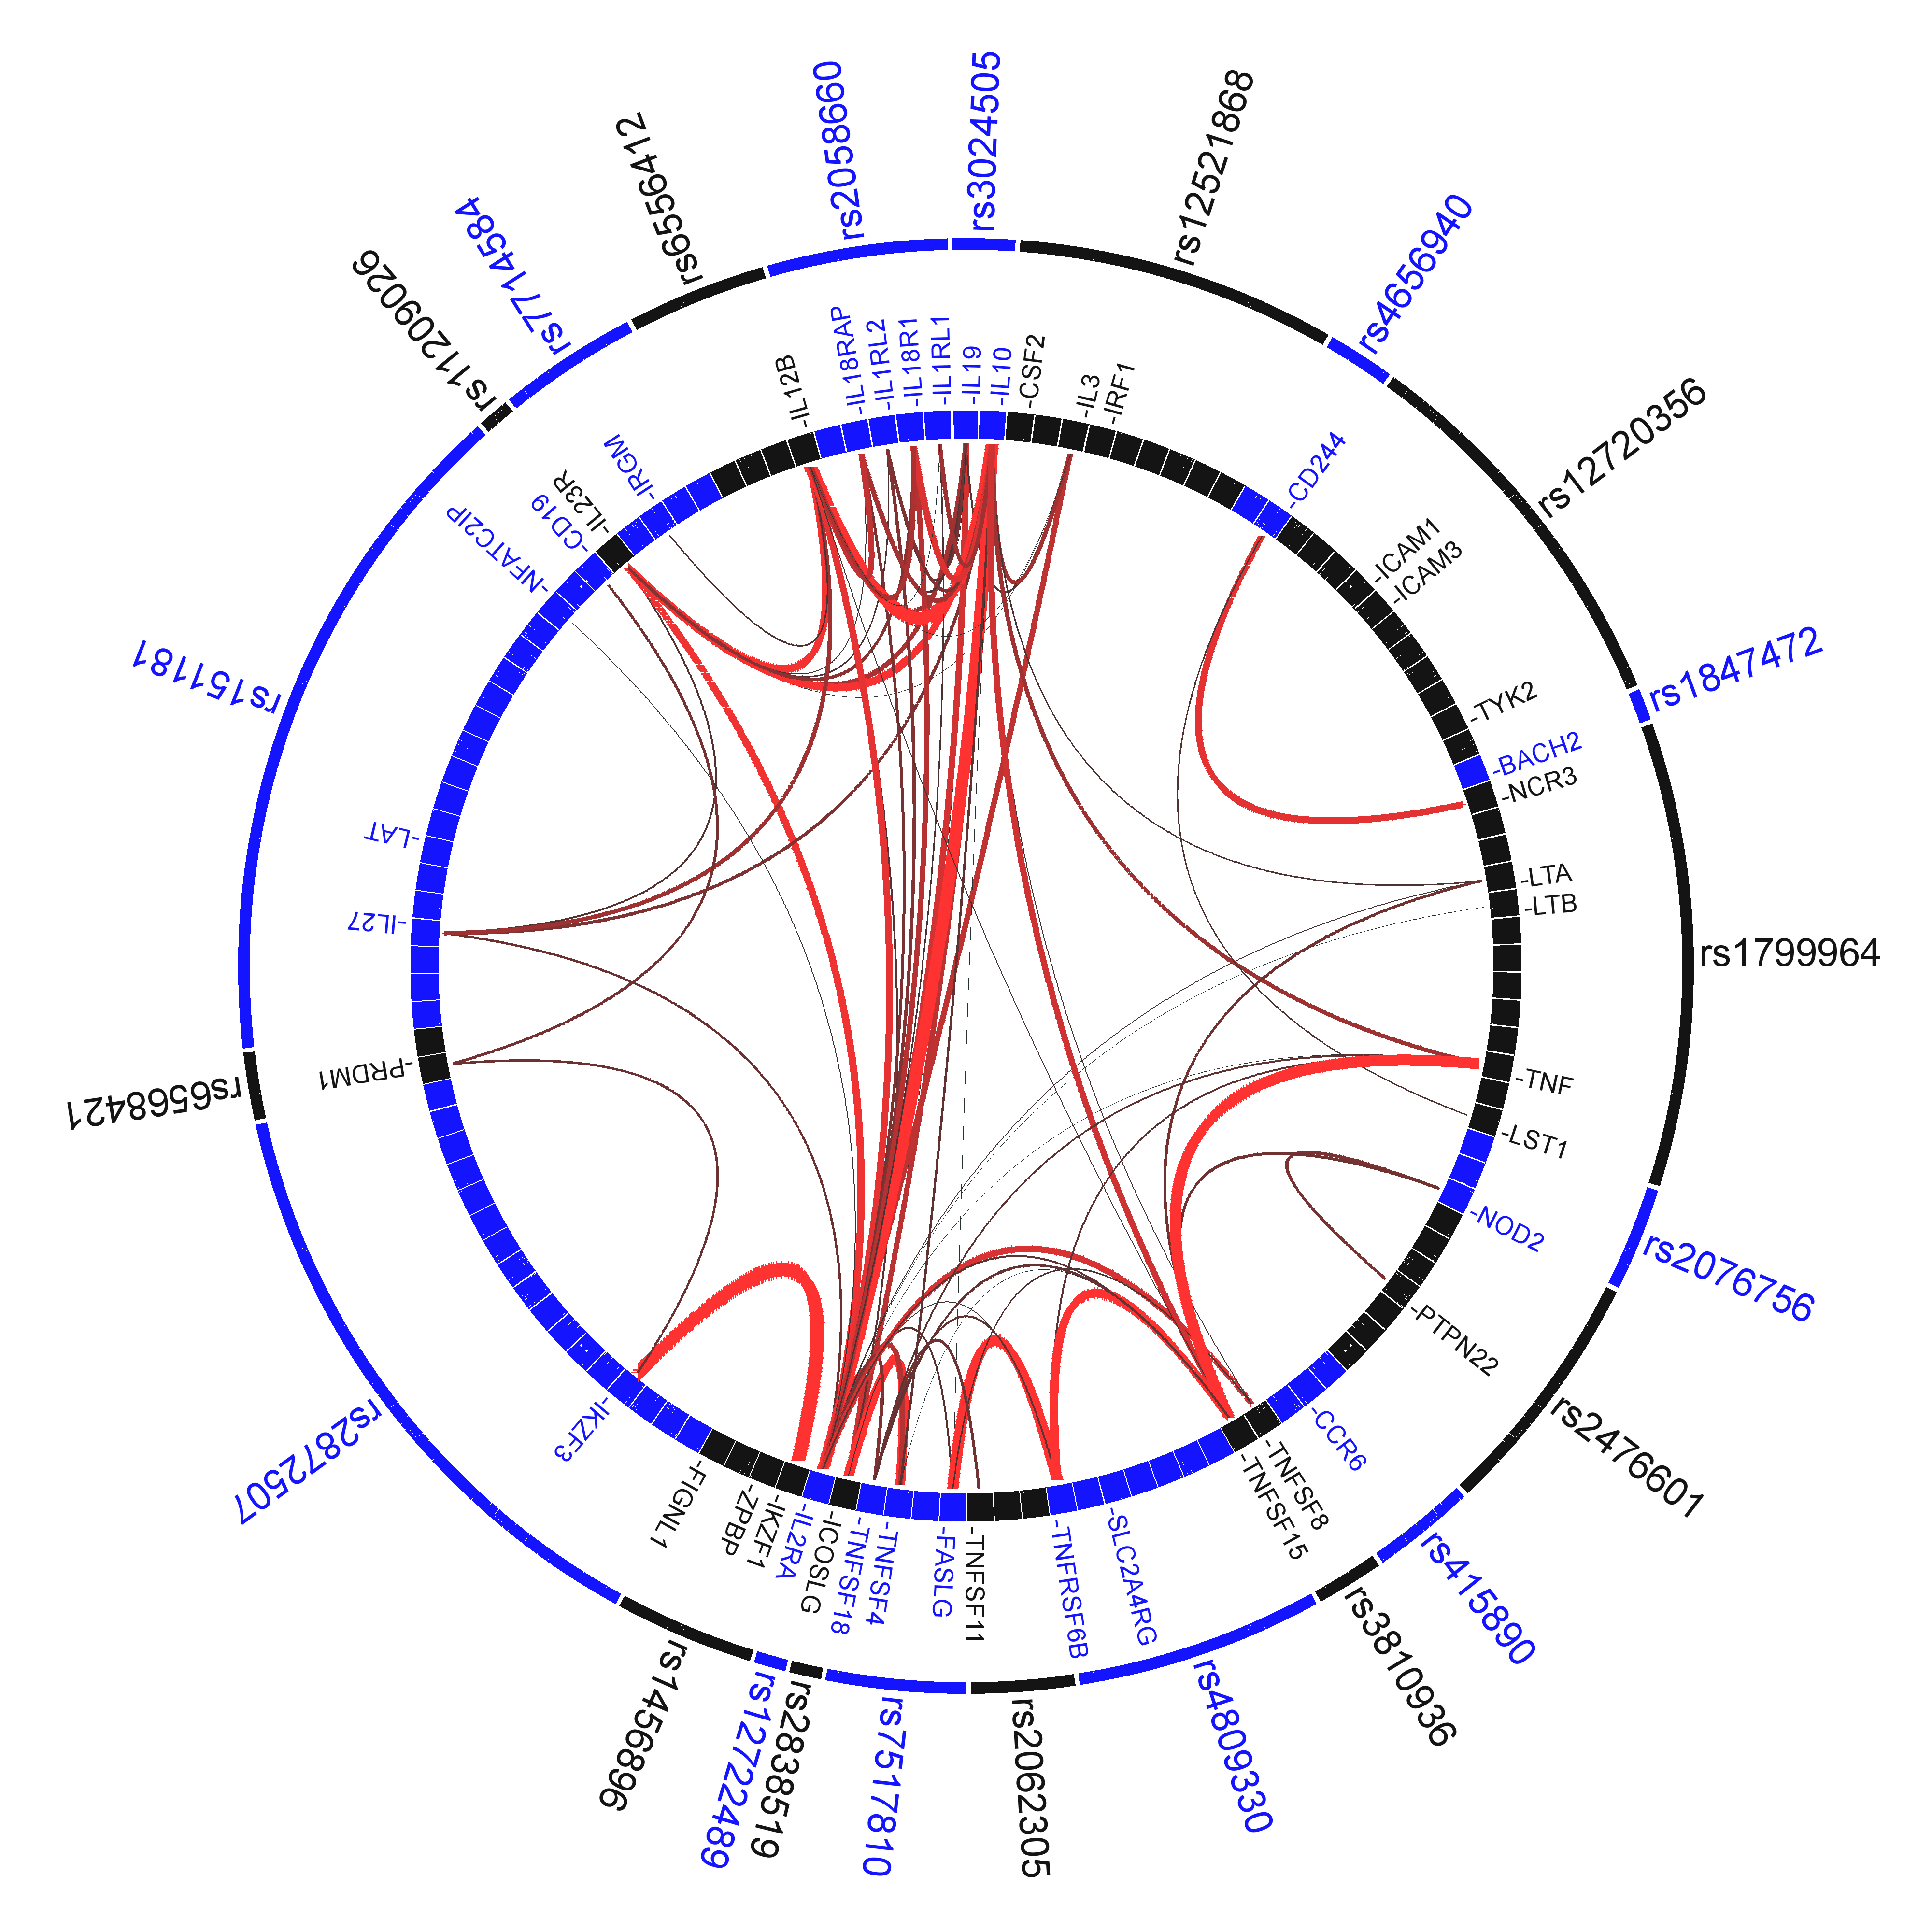
VIZ-GRAIL: Visualizing GRAIL connections

The VIZ-GRAIL software allows users to create informative circle plots of genetic loci that visualizes the functional similarites between genes in an intuitive manner. Code that interact with the online site is available here for download. VIZ-grail is implemented as two separate perl scripts. The first script "makeInputFiles.pl" interacts with the GRAIL website after GRAIL jobs have been completed to download results and generate two files a "connect" file (specifying pairwise gene connections) and "data" file (specifying the relationships of genetic loci and genes, and the statistical significance of the degree of connectivity for individual genes). These files are used with the "graphCluster" script to generate the actual graphic. The "graphCluster" script offers users the option to optimize the placement of genetic loci to minimize crisscrossing connections between genes, which can be confusing, and detract from the informativeness of the circle plots.
Links
- README
- Download makeInputFiles perl script
- Download graphCluster perl script
- Example Connect File : 1298689078_connections
- Example Data File : 1298689078_data
- Example Connect File : FIG1A_connect
- Example Data File : FIG1A_data
Any questions?
You can contact us at G R A I L at broad . mit . edu.