Uploads by Liberzon
Jump to navigation
Jump to search
This special page shows all uploaded files.
| Date | Name | Thumbnail | Size | Description | Versions |
|---|---|---|---|---|---|
| 19:11, 11 March 2011 | Msigdb c2 stats mar11 2011.png (file) | 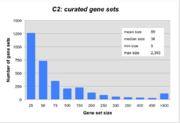 |
43 KB | 3 | |
| 19:21, 11 March 2011 | Msigdb c1 stats mar11 2011.png (file) | 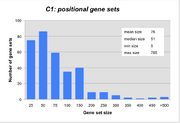 |
42 KB | Frequency histogram of gene set sizes from MSigDB 3.0 C1 collection plus summary stats. | 1 |
| 19:34, 11 March 2011 | Msigdb c3 stats mar11 2011.png (file) | 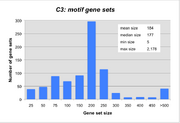 |
35 KB | 2 | |
| 19:42, 11 March 2011 | Msigdb c4 stats mar11 2011.png (file) | 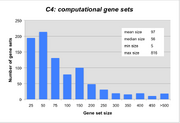 |
36 KB | Frequency histogram of gene set sizes from MSigDB 3.0 C4 collection plus summary stats | 1 |
| 19:51, 11 March 2011 | Msigdb c5 stats mar11 2011.png (file) | 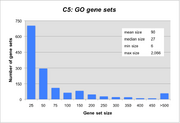 |
35 KB | Frequency histogram of gene set sizes from MSigDB 3.0 C5 collection plus summary stats | 1 |
| 13:39, 25 May 2011 | Genesets.jpg (file) | 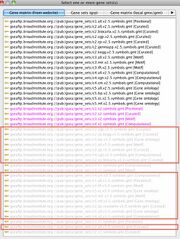 |
105 KB | screen shot from the GSEA v2.07 java desktop application showing v3.0 gene set files at the bottom of the list and in gray font. The gene set files are marked by red rectangles. | 1 |
| 13:16, 2 October 2012 | Loading MSigDB3.1.jpg (file) |  |
87 KB | Screenshot for MSigDB Browser showing how to view v3.1 MSigDB database from within v2.08 GSEA java desktop application. | 1 |
| 14:14, 2 October 2012 | Viewing GMT files.jpg (file) | 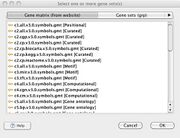 |
93 KB | The Gene sets database selection menu on the Run Gsea panel now lists gmt files in order of decreasing version. The latest version is displayed in a bold font. Within a version, collections are ordered by increasing collection number and within a collec | 1 |
| 00:27, 16 October 2012 | Msigdb growth 1012.png (file) | 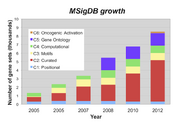 |
75 KB | 1 | |
| 12:56, 16 October 2012 | Viewing GMT files.png (file) | 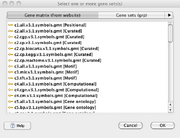 |
70 KB | 1 | |
| 15:43, 16 October 2012 | Rlogo.jpg (file) |  |
5 KB | 2 | |
| 15:45, 16 October 2012 | Poi-logo.png (file) |  |
6 KB | 2 | |
| 15:47, 16 October 2012 | Jfreechart.png (file) |  |
11 KB | 2 | |
| 15:49, 16 October 2012 | Log4j.jpg (file) |  |
4 KB | 2 | |
| 15:50, 16 October 2012 | Oro.logo.gif (file) |  |
4 KB | 2 | |
| 15:52, 16 October 2012 | Ecs-small.jpg (file) |  |
6 KB | 3 | |
| 16:00, 16 October 2012 | Xenu logo.png (file) |  |
22 KB | Xenu logo from http://home.snafu.de/tilman/xenulink.html | 1 |
| 19:29, 16 October 2012 | C1.v3.1.stats.png (file) | 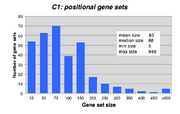 |
27 KB | 2 | |
| 19:44, 16 October 2012 | C2.v3.1.stats.png (file) |  |
28 KB | Frequency histogram of gene set sizes from MSigDB 3.1 C2 collection plus summary stats. | 1 |
| 19:52, 16 October 2012 | C3.v3.1.stats.png (file) | 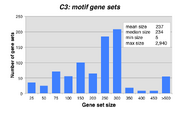 |
24 KB | Frequency histogram of gene set sizes from MSigDB 3.1 C3 collection plus summary stats. | 1 |
| 19:59, 16 October 2012 | C4.v3.1.stats.png (file) | 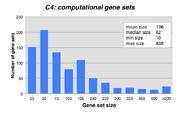 |
26 KB | Frequency histogram of gene set sizes from MSigDB 3.1 C4 collection plus summary stats. | 1 |
| 20:05, 16 October 2012 | C5.v3.1.stats.png (file) | 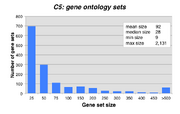 |
27 KB | Frequency histogram of gene set sizes from MSigDB 3.1 C5 collection plus summary stats. | 1 |
| 20:11, 16 October 2012 | C6.v3.1.stats.png (file) | 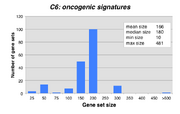 |
25 KB | Frequency histogram of gene set sizes from MSigDB 3.1 C6 collection plus summary stats. | 1 |
| 12:14, 5 June 2013 | Msigdb growth 2013.png (file) |  |
86 KB | 1 | |
| 17:42, 13 January 2016 | Msigdb.v5.1 stats.png (file) | 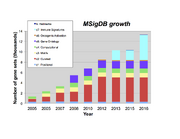 |
126 KB | 1 | |
| 11:52, 6 October 2016 | Msigdb.v5.2 stats.png (file) | 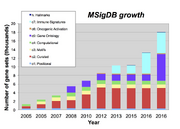 |
453 KB | 1 | |
| 14:27, 6 April 2017 | Msigdb stats 6apr2016.jpg (file) | 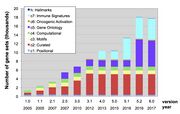 |
138 KB | 1 |