Sweep™ allows large-scale analysis of haplotype structure in genomes for the primary purpose
of detecting evidence of natural selection. Primarily, it uses the Long Range Haplotype (LRH) test to look for alleles of high frequency with
long-range linkage disequilibrium (LD), which suggest the haplotype rapidly rose to high frequency before recombination could break down
associations with nearby markers ( Nature 419(6909): 832-7).
Sweep takes phased genotype data as input, detects all haplotype blocks in that data, and then determines the frequency and long-range LD for
each allele in each block.
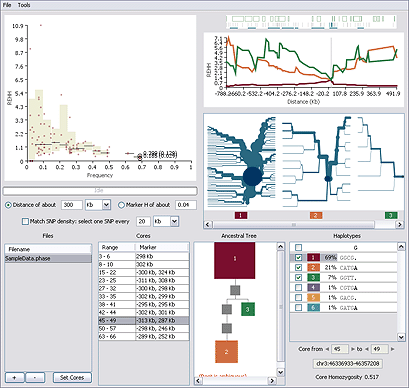
Starting at the top left and moving clockwise:
| |
 EHH vs. Frequency Plot EHH vs. Frequency Plot
| | |
The scatter plot shows REHH (or EHH) plotted against haplotype frequency for each core region of the genome. Clicking on the Y-axis toggles between REHH and EHH. The currently selected core is circled; you can click a point to select a different core.
| |
 Gene Track Gene Track
| | |
The gene track shows the genomic location of the currently selected core, the genes in the region (blue-outlined boxes), the SNPs from your data file (vertical lines), and the Sweep-identified haplotype blocks (horizontal blue lines).
| |
 EHH vs. Distance Plot EHH vs. Distance Plot
| | |
The line chart plots REHH (or EHH) for the current core and selected haplotypes at every long-range distance in both directions from the core region. The lines are color coded to match the haplotypes listed in the Haplotypes Table (lower right).
| |
 Bifurcation Plots Bifurcation Plots
| | |
The Haplotype Bifurcation diagram shows the breakdown of linkage disequilibrium (LD) at increasing distances in both directions from the selected core region. The root of each diagram is the core haplotype (dark blue circle). The thickness of the lines corresponds to the number of samples with the indicated long-distance haplotype.
| |
 Haplotypes Table Haplotypes Table
| | |
The Haplotypes table lists the haplotypes at the current core region. Haplotypes observed in your data are numbered and color-coded. Where ancestral information is available, Sweep displays the predicted ancestral haplotypes at the top of the list. The dots (.) in an observed haplotype sequence represent alleles that match the ancestral.
| |
 Ancestral Tree Ancestral Tree
| | |
The Ancestral Tree shows a phylogenetic tree of the haplotypes at the current core region. Haplotypes closer to the ancestral are at the top of the figure. Gray squares represent haplotypes that are not present in your data, but are missing links in the phylogeny. The area of the squares is proportional to the frequency of the haplotype.
| |
 Cores Table Cores Table
| | |
The Cores table lists the core regions observed in your data. The currently selected core is highlighted; you can click a range to select a different core.
| |
 Files Table Files Table
| | |
The Files table lists the input genotype data files.
|

